![]()
General Module Function
This module has many features which are available only in EVS-PRO and MVS.
contour_data provides a means to color surface and volumetric objects in solid colored bands vs. the default Gouraud shading (smoothly changing colors).
This module does not do subsetting like plume_shell (plume_shell), plume_volume, plume_area. It is used in conjunction with these modules to change the way their output is colored.
Module Input Ports
This module has 2 import ports:
The leftmost port accepts an input field
The levels information which can be passed between modules. The modules with this port are contour_data, isolines, Datamap_Editor, and Legend.
Module Output Ports
This module has 2 output ports:
The leftmost port is the levels information which can be passed between modules. The modules with this port are contour_data, isolines, Datamap_Editor, and Legend.
The (red) port for connection to the Viewer.
Module Control Panel
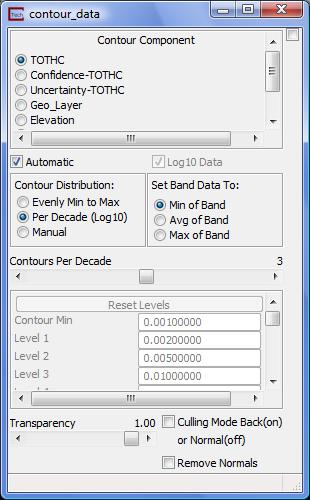
The parameters which you may control are:
Contour Component is the data component which will determine the solid colored bands
The Automatic toggle selects whether your data is Log processed for you
The Log10 Data toggle is inactive if Automatic is ON.
Contour Distribution has 3 options
Evenly Min to Max is the only option available to EVS-Standard. It sets N bands evenly spaced from your data Min to Max.
Per Decade (Log10) allows you to set bands which are similar to the intervals in the Legend module.
Manual allows you to set any intervals you wish.
Set Band Data To: has three options which determine what color is assigned to each solid colored band.
Min of Band chooses the color (according to your Datamap) which would be determined by the minimum value of each band
Avg of Band chooses the color (according to your Datamap) which would be determined by the average value of each band
Max of Band chooses the color (according to your Datamap) which would be determined by the maximum value of each band
The Number of Contours slider changes its name depending on the Contour Distribution option chosen.
Evenly Min to Max is labeled Number of Contours
Per Decade (Log10) is labeled Contours Per Decade
Manual is labeled Number of Contours. When Manual is chosen, the values for each band can be manually set.
The Transparency slider controls the transparency of the output
The Remove Normals toggle is equivalent to setting Normals Generation (in Object.Modes) to None. This changes the rendering of surfaces and is sometimes preferable.
The Culling Mode Back (on) or Normal (off) toggle is equivalent to setting the object surface property to cull back facing surfaces. This is recommended whenever Opacity is less than 1.00
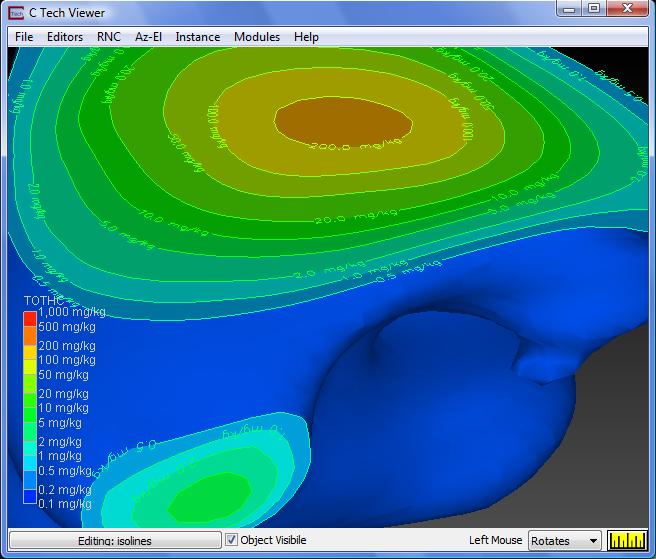
An application showing the proper use of contour_data is shown below
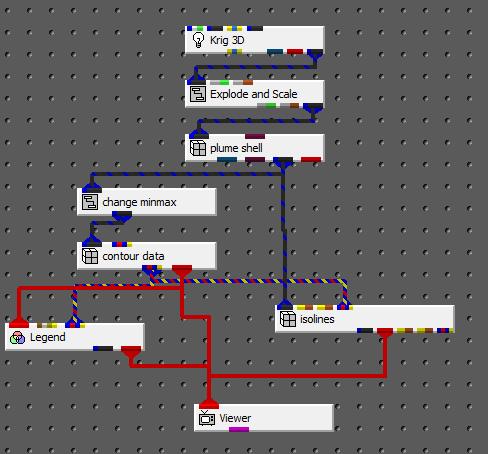
The resulting output is below. Please note that the Legend and isolines automatically share the contour levels set in contour_data.
change_minmax is used in the application to cause the resulting colors to have more dynamic range for the plume level chosen (in plume_shell). Without this module, the colors would only be light blues to yellow.
© 1994-2018 ctech.com