![]()
General Module Function
This simple module allows the user to create complex multi-range datamaps. The user simply connects the Datamap_Editor module to the object's red port.
Module Input Ports
Datamap_Editor has two input ports.
The first port (red) should be connected to the module whose rendered object you would like to color.
The second port (blue-red-blue-beige) is found on only a few modules in EVS/MVS. The modules with this port are contour_data, isolines, Datamap_Editor, and Legend.
These modules pass data corresponding to one or more subsetting levels (or solid contour levels). When this data is passed to Datamap_Editor, it is used to set the precise break points where datamap ranges (colors) will change. You still need to specify the colors for each of these ranges.
Module Output Ports
None
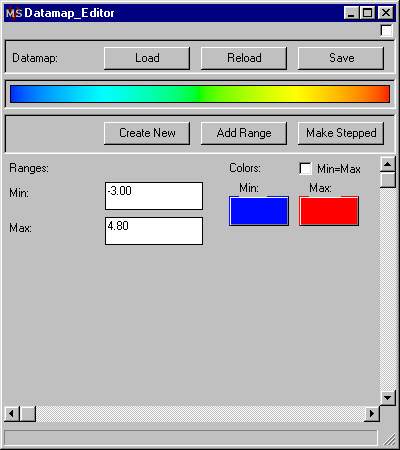
Module Control Panel
The Datamap_Editor control panel is shown above. Because of the numerous options associated with this module, a short tutorial follows.
Let’s begin by building a simple network. We’ll read the UCD file initial_soil_investigation_subsite.inp for this example.
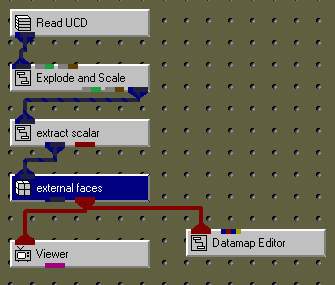
The picture in your viewer should match that below.
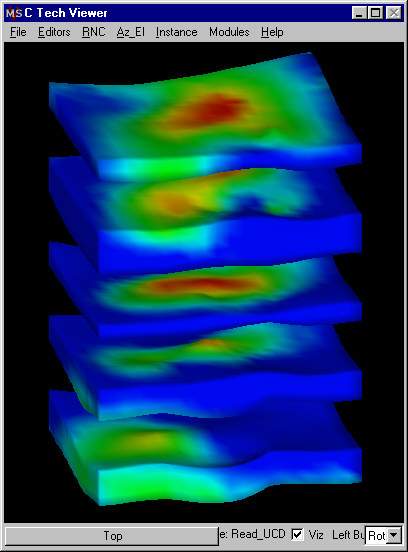
If you open the Datamap_Editor’s panel, it will look like this:

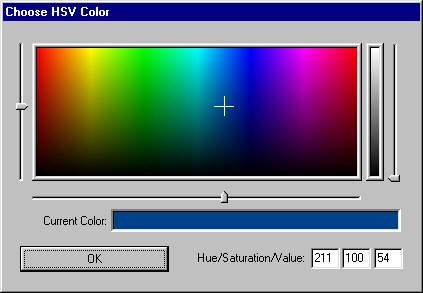
Press the blue button, which corresponds to the color that the data minimum maps to. It will pop up a color selector window. Pick a color similar to that shown below and hit OK.
At this point, your datamap editor should reflect the changes that you have made to the min color and the resulting datamap.
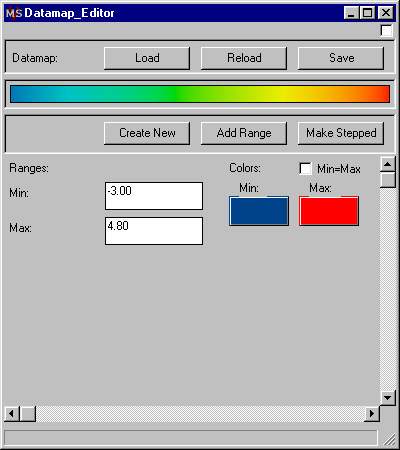
The picture in your viewer should match that below. This is the simplest use of the Datamap_Editor. You can change the color that the data Min or Max maps to.
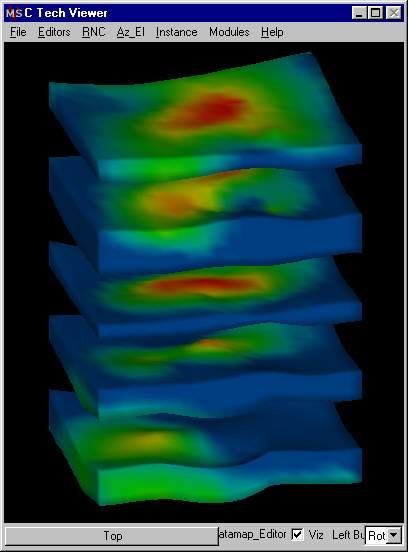
Now let’s set extract_scalar’s data component to Geo_Layer and then go back to the Datamap_Editor’s panel and hit the Add_Range button 4 times. Datamap_Editor should now look like:
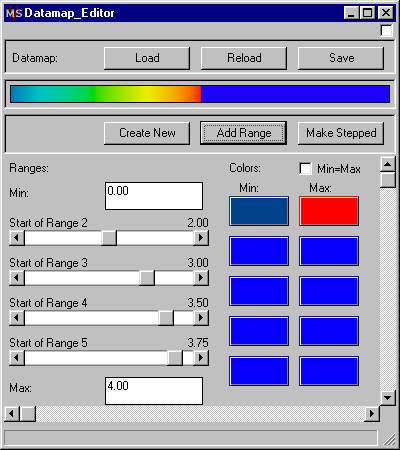
Hit the "Make Stepped" button and the panel will change to look like below. Make Stepped is specifically for data like geo_layer and material colors:
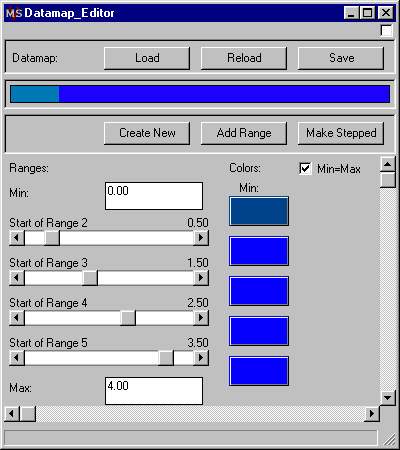
Select each of the four Blue buttons for ranges 2-5 (you can change the first one also if you want to) and change the color to the color you desire for each geologic layer. Your Datamap_Editor should now look something like:
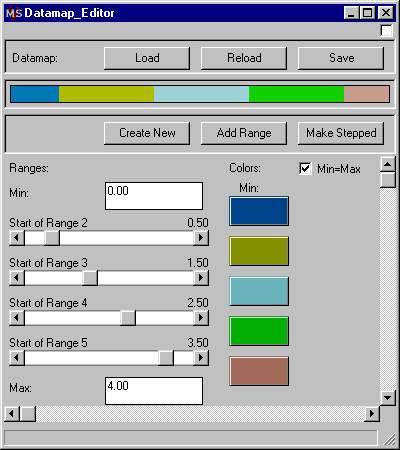
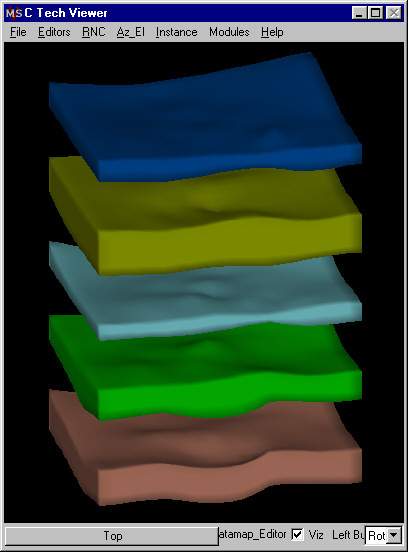
And the Viewer will now show layers with those colors.
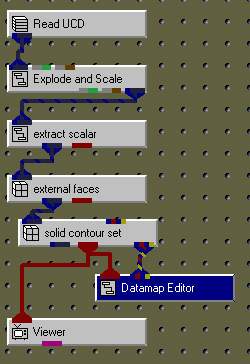
Now let’s change the network to include the module solid_contour_set. This module (and a few others like isolines) has a special output port made to pass contour levels. This information can be used by the Datamap_Editor to set the break points in the datamap to exactly correspond to the levels. Datamap_Editor then allows you to set each color individually.
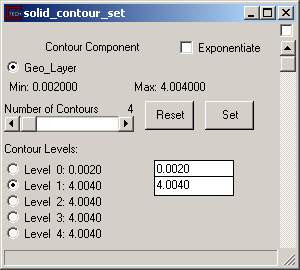
Set the levels and settings in solid_contour_set to match those shown below.
Open the Datamap_Editor panel and turn on the "Min=Max" toggle. The panel should have 5 identical blue buttons. Set the color for each range and your Datamap_Editor should now look something like this.
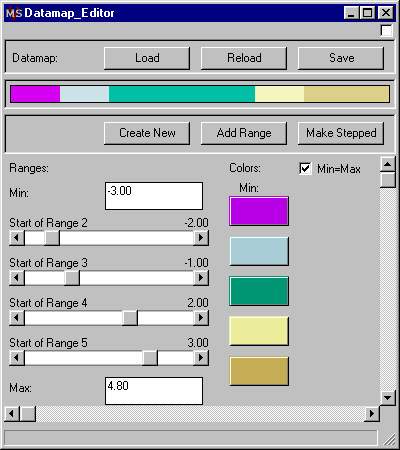
With the colors for each solid contour set, the Viewer should look like that below.
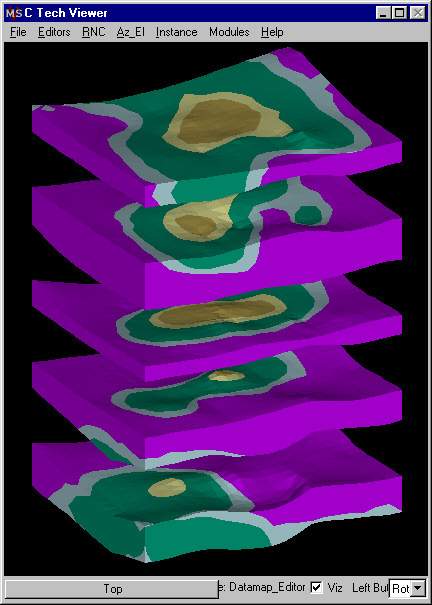
© 1994-2018 ctech.com