![]()
General Module Function
The statisitics module is used to analyze the statistical distribution of a single data field. The data field can contain a number od data components. Statistical analyses can only be performed on scalar data components. An error occurs if a statisitical anlaysis is performed on non-scalar data. Output from the statistics module appears in the EVS Status Window. Output consist of calculated min and max values, the mean and standard deviation of the data set, the distribution of the data set, and the coordinate extents of the model.
Module Input Ports
Statistics has two input ports.
The first port (the leftmost one) should contain a mesh with nodal data. If no nodal data is present, statistics will only report the extents and centroid of your mesh. Data sent to the statistics module for analysis will reflect any data transformation or manipulation performed in the upstream modules. Any mesh data sent to the port is used for calculating the X, Y and Z coordinate ranges. The mesh coordinates have no affect on the data distribution. Cell based data is not used.
The second port is the z scale factor, which affects the centroid of the model.
Module Output Ports
![]()
By default, there are no output ports on the statistics module. However the Export button causes 6 output ports to be visible. These are (from left to right):
mean
median
min
max
number of points
The string (characters) representing the total output from Statistics.

Module Control Panel
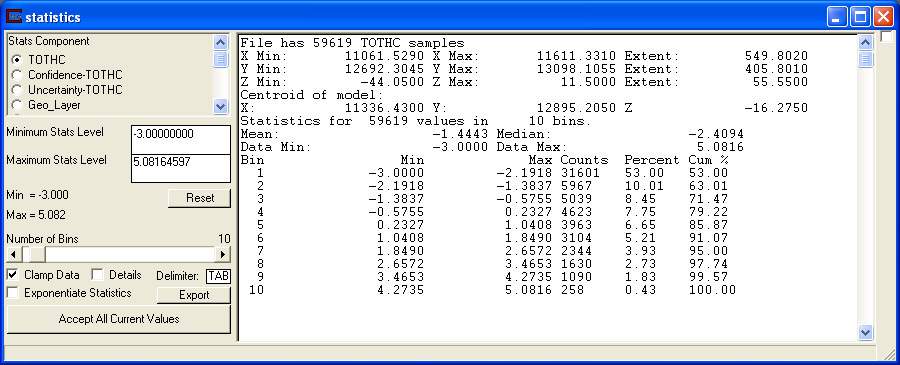
The control panel for statistics is shown in the figure above.
Radio buttons are used to pick the Stats (data) Component on which the statistical anaylsis is to be performed. The list of radio buttons will display all avalilable data components passed to the input port. The first data component is the default. If the chosen data component is a vector, an error will appear in the EVS Status Window indicating this.
The Minimum Stats Level and Maximum StatsLevel edit boxes are used to set the upper and lower limits on the data bins for statistical analysis. The default values are the minimum and maximum values in the data component. If the statistical distribution should focus on only a portion of the data, these values can be changed to reflect only that desired range of data. The Min and Max values in the data component are shown below these edit fields.
The Reset button restores the Min/Max values to their default data extremes.
The Number of Bins slider is used to set the number of distribution bins to be used in the analysis. The default is 10 and the range is from 2 to 255. This value is generally changed to get unary or aesthetically pleasing bin values. For example, if the data min is -3.0 and the data max is 2.0, setting the Number of Bins to 6 will result in unary bin values (e.g. -3, -2, -1, etc.)
The Clamp Data toggle will actually clamp the data to the Minimum and Maximum Stats Level before processing it for statistics.
The Details toggle will display additional statistical information such as variance, deviation and quartile values.
The Delimiter type in controls the spacing of the output window. The text of the output window will be broken up according to whatever is in the Delimiter box, there is one special delimiter tag and that is the word "TAB" which allows the text to be tab delimited.
The Details toggle will display additional statistical information such as variance, deviation and quartile values.
The Export button causes 6 output ports to be visible. These are described above.
The Accept All Current Values button causes the module to re-run.
![]()
The Accept All Current Values button is used to tell statistics to calculate the distribution using the current settings. Results of the statistical analysis are sent to the EVS/MVS Status Window and the output panel on the right side of statistics' main panel.
© 1994-2018 ctech.com