Since the effect of anisotropy on Indicator Kriging is virtually identical for the Quick Method and probabilistic kriging, let's return to the basic network used two topics ago.
It can be loaded from ctech\applications\pro\5_material_complex_indicator_geology_quick.v. The network is shown in the figure below:

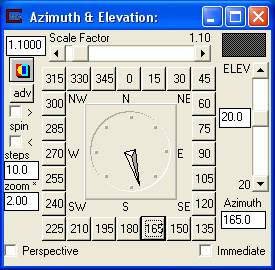
When this application runs, turn on all of the materials in Explode_and_Scale, and set the view to match:

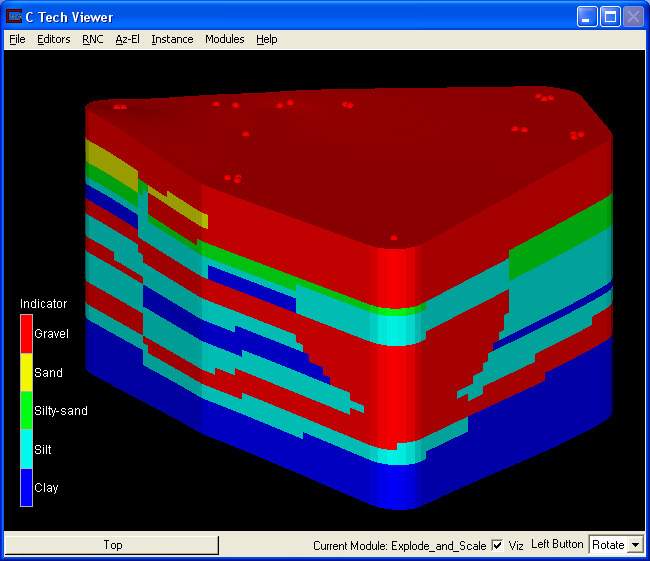
The resulting model shows:

We'll make a single change and see how dramatic its affects can be.
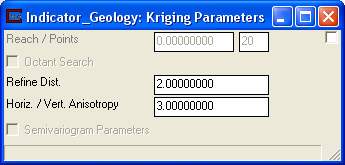
Select Indicator_Geology from the module list and open the Kriging parameters window. Change anisotropy from 10.0 to 3.0 and Click on Accept All Current Values to re-run.

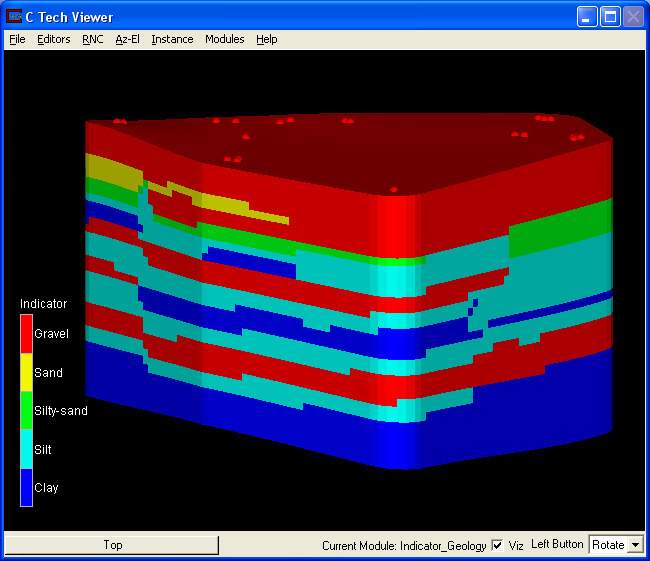
When complete your view should now show

Note that this model changes most dramatically in areas with little or no data.
The near corner (for this view) is where we have a single short boring. Let's turn off Gravel (in Explode_and_Scale) so we can better see what is happening. With a -20 degree elevation it looks like:

What are we seeing?
When the anisotropy was set to 10, we are saying that distances in the x-y plane are 10 times further than distances in the z direction.
With the anisotropy set to 3, x-y distances are 3 times further than distances in the z direction. This causes the effect of this short boring that ends in gravel to propagate further into our model. In fact since our z-exaggeration (in Explode_and_Scale) is set to 3, distances appear to be computed isotropically. Effectively, the short boring creates a nearly spherical region of gravel for this vertical exaggeration.
Similarly if we change anisotropy to 100 we should expect the layers to propagate horizontally more like flat sheets. With a 10 degree elevation and the Gravel turned back on, this would change our view to:

© 1994-2018 ctech.com