Indicator_Geology-Indicator Kriging
The most notable difference using Indicator_Geology to perform Geologic Indicator Kriging (GIK) as compared with hierarchical layered models is that the boundaries between materials are blocky. This is the result of using a totally different approach. With GIK, a default grid is created (with a user-specified fineness). This grid can be (and is in this case) defined between two geologic surfaces (e.g. ground surface and the bottom of gravel). There are significant advantages to constraining the GIK to a top and bottom surface. First (and foremost) is that the ground surface of the resulting geologic model WILL follow the actual terrain. The single layer (two surfaces) geology file that was used to constrain the model domain in this workbook topic is 5_material_complex_geology_single_layer.gmf. The content of this file is shown below. Note that only four borings were deep enough to define the bottom of the model.
# Single layer 5_material_complex_geology GMF file
# Surface #0
units meters
surface 4 Gravel
2084941.150002 323298.839996 33.000000 OW-1A
2084941.290001 323310.529999 32.000000 OW-1B
2084948.070000 323309.399994 32.000000 OW-1C
2085079.220001 323361.000000 32.000000 MW-10B
2085108.470001 323363.890015 32.000000 MW-10A
2085171.220001 323387.250000 31.000000 X4-B
2085184.589996 323397.190002 32.000000 X4-A
2085266.929993 323410.049988 32.000000 MW-11A
2085274.820007 323407.700012 32.000000 MW-11B
2085153.839996 323253.399994 31.000000 X-2A
2085176.869995 323061.139999 31.000000 X-1B
2085192.220001 323066.870003 31.000000 X-1C
2085194.259995 323052.759998 31.000000 X-1A
2085487.119995 322869.949997 31.000000 AW-3
2085634.320007 323366.940002 31.000000 OW-4B
2085640.820007 323381.970001 31.000000 OW-4A
2085629.750000 323379.660004 31.000000 OW-4C
2085553.919983 323379.029999 31.000000 MW-12B
2085538.950012 323379.769989 31.000000 MW-12A
2085555.890015 323523.869995 31.000000 OW-3B
2085547.710022 323517.630005 31.000000 OW-3C
2085536.450012 323527.400024 31.000000 OW-3A
# Surface #1
surface 0 Clay
2084948.070000 323309.399994 -105.950002 OW-1C
2085192.220001 323066.870003 -102.950002 X-1C
2085547.710022 323517.630005 -107.950002 OW-3C
2085629.750000 323379.660004 -115.950002 OW-4C
end
AEC9615FC43E7EB25ECDD17298166091
The Indicator Kriging process uses a .pgf file as DATA for the material assignment. It does not use it to constrain the extent of the model creation. We will be using 5_material_complex_geology.pgf.
Indicator_Geology includestwodifferent methods for assigning geologic data to cells in your model grids.
1)TheQuick Methodis similar (but improved) to the Geologic Indicator Kriging that was in Krig_3Dprior to version 6.0. It assigns the geologic material cell data based on the nearest geologic material (in anisotropic space) to your PGF borings. This is done based on thecoordinateof thecell'scenter and an enhanced refinement scheme for the PGF borings.
2)Indicator_Geology also includes a rigorous probabilistic approach to geologic indicator krigingthat will be discussed in thenext topic.
The application we will be running in this topic uses the QuickMethod which runs quite fast. It can be loaded from ctech\applications\pro\5_material_complex_indicator_geology_quick.v. The network is shown in the figure below:

The finer the grid (especially in the vertical direction) the more accurate the representation. GIK assigns the most probable material to each CELL in the model. The assignment to a cell is a significant distinction as compared with all other interpolation performed in EVS/MVS. If geologic data were assigned to nodes (vs. cells), in areas where there is a transition between two non-sequential material id's, colors would be interpolated between them that could correspond to intermediate materials. Using the cell data paradigm, we can have regions that transition from Clay to Gravel without seeing any other materials interpolated in between.
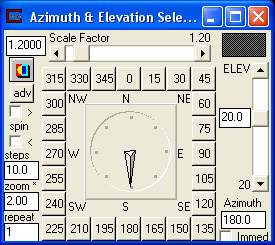
Set the parameters in Azimuth & Elevation to match:

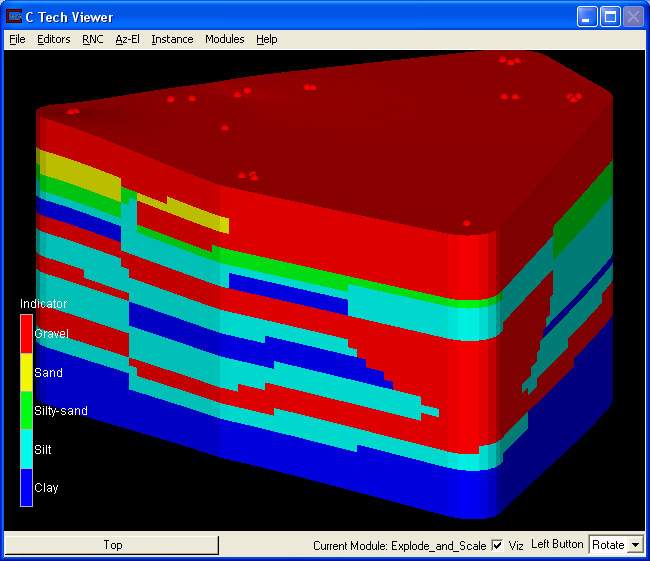
Then turn on all of the materials in the Geologic Layers section in Explode_and_Scale. Your Viewer should show the GIK model produced with the QuickMethod.

If you compare this output to the unexploded model in the previous topic you will see many similarities and differences. The most notable area of differences in the near right corner of the model. Let's investigate why this area is so different.
If we turn off the Gravel material:

and change the elevation of the view to 5.0 degrees the reason for the differences are obvious! With the Gravel removed, the nearest boring is revealed to be very short. It was stopped just after it entered the gravel. With the hierarchical approach the subsequent surfaces were extrapolated into this region without any data to support their elevations. Similarly with the GIK approach the material assignments below the boring are based on other borings (far away!) and consequently the gravel extrapolates downward a significant distance in the absence of better data!

So which is right?
The answer is that we don't have any data to determine which method is more correct. Both approaches give us some insight into the geology of this site and the GIK approach makes our data shortcomings quite obvious.
Also note that regions produced with GIK can have vertical transitions and folds. It is not encumbered by the layered approach of geologic hierarchy. Similarly it does not provide any means to explode layers. Moreover the entire concept of layers is meaningless with GIK. There are not layers represented by a GIK model, only materials.
If the resulting model shows clear evidence of layering it is a good indication that we should probably be using the hierarchical modeling approach instead!
Rigorous investigation of the geology of a site should generally include GIK in addition to hierarchical modeling (if appropriate).
The following five figures show the individual cell sets corresponding to each material. The visibility of each cell set is controlled using the toggles in the Explode_and_Scale module.
For the first material, the clay zones are shown below.

For the second material, the silt zones are shown below.

For the third material, the silt/sand zones are shown below.

For the fourth material, the sand zones are shown below.

For the fifth material, the gravel zones are shown below.

© 1994-2018 ctech.com