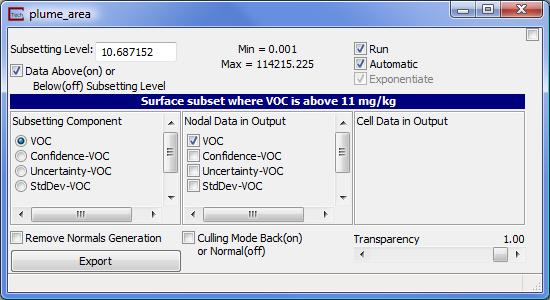
The plume_area module creates a surface whose data lies above a constant value. Let's experiment with plume_area's user interface, accessible through the Modules - pull-down menu.
Work with plume_area
a. Select the plume_area module's user interface from the Modules - pull-down menu or by double clicking on the module in the application area. The user interface for plume_area appears.

Notice that the current Subsetting Level is 10.687152 This means that we're producing a subset of the data for all values greater than 10.687152 mg/kg. Because only small regions of the domain are above 10.687152, the image we produce has several disjoint colored regions.
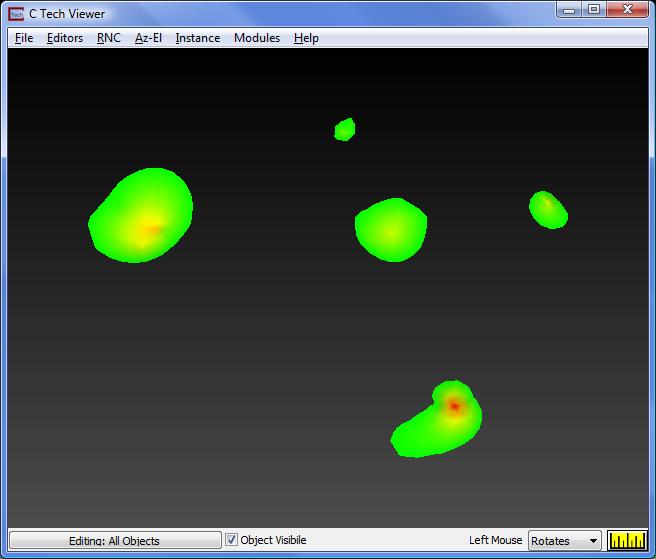
b. Actually, our data was "kriged" after being "log" processed. However, the displayed value of 10.687152 corresponds to an actual concentration just over 10 mg/kg.
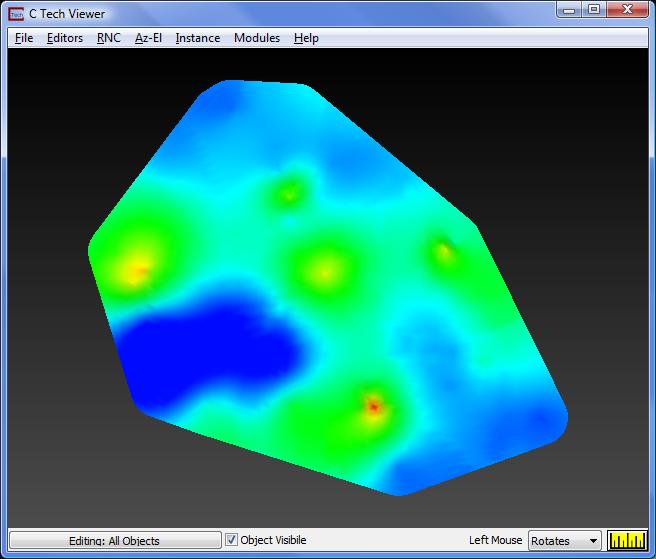
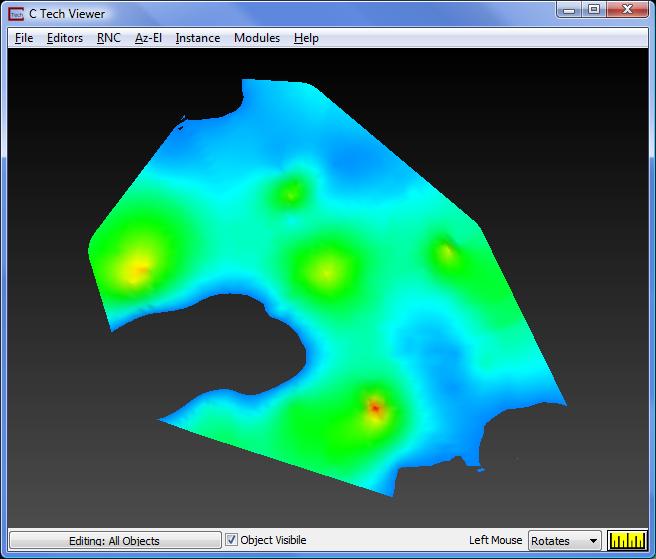
If we want to see the entire kriged area, we would set the Subsetting Level to the Min(imum) value for our selected Subsetting Component (VOC). That value is 0.001
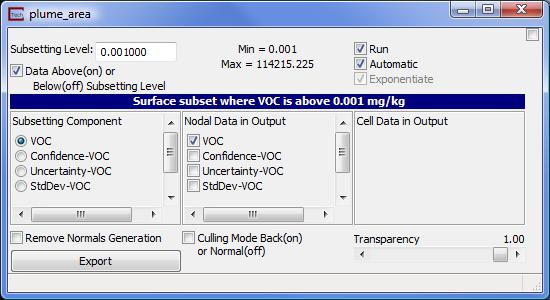
Because the plume_area previously gave us only a portion of the view, the viewer will automatically normalize and center the object and you should get the following view.
Let's go back to a subsetting level that will give us only a portion of the model and we'll fill in the rest with lines corresponding to the entire model's grid. The value must be within the displayed min and max values (0.001 to 114,215.225). For this example we will choose 0.01
© 1994-2018 ctech.com