
Let's execute the analysis module, Krig_2D, in order to produce a model based on the data file we have selected
Read a file
a. Double click on Krig_2D in the Application area to open its user interface (shown below). Alternatively, select the Krig_2D pull-down command from the Modules - pull-down menu. The Krig_2D Main menu window appears.
b. Select the Read Data File button.
c. Select initial_soil_investigation_full_site.apdv from the Files list box.

d. Select the Open button.
e. Before we run, let's modify one of the parameters. Open up the Krig_2D Display Settings subwindow by clicking on the "Display Settings" toggle.
f. Set the "Surface Vert. Scaling" to 50.0. Before going on to the next step, close the Krig_2D Display Settings subwindow by clicking on the toggle again. After the module runs, this subwindow will be updated and has many powerful options (which we will not address in this workbook).

g. Select the Accept All Current Values button in the main Krig_2D window.
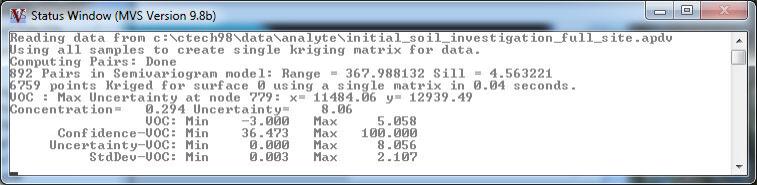
Krig_2D reads the analyte (e.g. chemistry) data and begins the kriging process. In a very short time, it calculates the estimated concentrations for the grid we selected. While it runs, Krig_2D prints messages to the console such as percentage completion. When it is done, the console message should look like this:
The viewer will promptly display a top view of the surface we have estimated. Your viewer should look like this:

Please note the gray sphere in the upper left region. This sphere denotes the location of highest uncertainty at this site. A detailed discussion of this subject is presented in Workbook 2 - DrillGuide©. In subsequent topics of this workbook this sphere will not be visible.
© 1994-2018 ctech.com