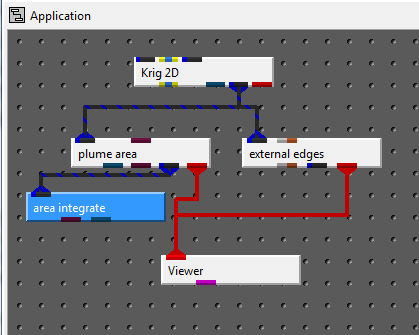
In order to quantify that difference, we modify our network as shown below.
Each new module in the above application plays an important role.
plume_area allows us to subset the domain and display only those portions above (or below) some threshold concentration (the subsetting level).
external_edges is somewhat optional, but gives us a display of the outline of the entire extent of the domain.
area_integrate computes the surface area of all portions of the domain meeting the plume_area subsetting criteria.
Since area_integrate computes the total surface area, we want to eliminate the Surface Vert.Scaling, in the Krig_2D Display Settings window, by setting it to 0.0. Otherwise the computed area will be artificially increased by the topography. We also will go back to viewing our nominal plume by setting the Data Component to VOC.

Next, set the external_edges' Max Edge Angle to 90 to show only the outside edges of the domain.

Then, open plume_area and set the Subsetting Level to 0.1 ppm, with the other settings as shown below.

Since we are looking at a flat 2D display, let's go back to a top view by selecting Top View from the RNC drop down menu on the Viewer. This will give us a display of the Nominal contaminated area for initial_soil_investigation_full_site.apdv.

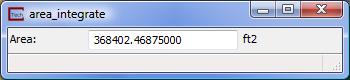
This area (as shown below) is 368,402 sq. ft.
© 1994-2018 ctech.com