
Our original data file initial_soil_investigation_full_site.apdv has 273 samples from 43 borings. This is a very under characterized site, especially considering the extremely high spatial variation in data. There are locations on this site where concentrations vary by orders of magnitude in just a few feet. Even when we take the average concentration over each boring, the variation is extreme. The table below shows a few borings and computes the distance between them and shows how dramatically the concentrations vary.
|
X |
Y |
Average-VOC |
Boring |
VOC-Ratio |
Distance |
|
11983.5 |
12423.6 |
3.586 |
CSB-7 |
|
|
|
12007.8 |
12430.6 |
686.1 |
CSB-39 |
191.3 |
25.29 |
|
12019.8 |
12422.9 |
37307.8 |
CSW-10 |
54.4 |
14.25 |
|
|
|
|
|
|
|
|
12004.8 |
12499.4 |
0.237 |
CSB-9 |
|
|
|
12007.8 |
12430.6 |
686.1 |
CSB-39 |
2895.0 |
68.86 |
In the table above, VOC-Ratio is the ratio of the concentration in that row divided by the concentration in the row above. Similarly the Distance is the distance in feet between those borings. What this shows is that moving away from CSW-10, in only 14 feet, the concentration changed by a factor 54. Only 25 feet from CSB-39 it dropped by a factor of nearly 200 and moving in another direction towards CSB-9 it dropped by a factor of nearly 3,000!
We can estimate the average spacing between our borings by taking the square root of: the total domain area divided by the number of borings. This data set has borings that are clustered, so we know in advance that this is only an estimate of average spacing.
Our total site area is 669,509 square feet. Given that our initial data file had 43 borings that would be an average spacing of about 125 feet. However, our table above shows that in about half that distance we could have a VOC variation of nearly 3,000 mg/kg!
If you open the integrate_area window you will see that the nominal area contaminated above 0.1 ppm is 368,402 sq. ft.

If we switch plume_area to compute the minimum expected area

our display changes to:

and the computed area is down to 187,369 sq. ft. (about half of the original!).

Similarly, our maximum expected area can be determined.

The maximum area display shows a markedly greater contaminated area.

The maximum area is 553,695 square feet.

The table below computes some simple measures of the quality of the site assessment for the initial case. Note that the ratio between the maximum and minimum expected area is nearly 3.0.
|
Nominal area |
368402 |
Deviation |
|
Minimum area |
187369 |
-49.1% |
|
Maximum area |
553695 |
50.3% |
|
Max / Min area ratio |
2.96 |
|
Note: for the calculations above and later in this topic, the normalized Deviation is computed as Delta / Nominal, where Delta is (Minimum - Nominal) or (Maximum – Nominal).
First, let's set plume_area to go back to viewing our nominal plume.

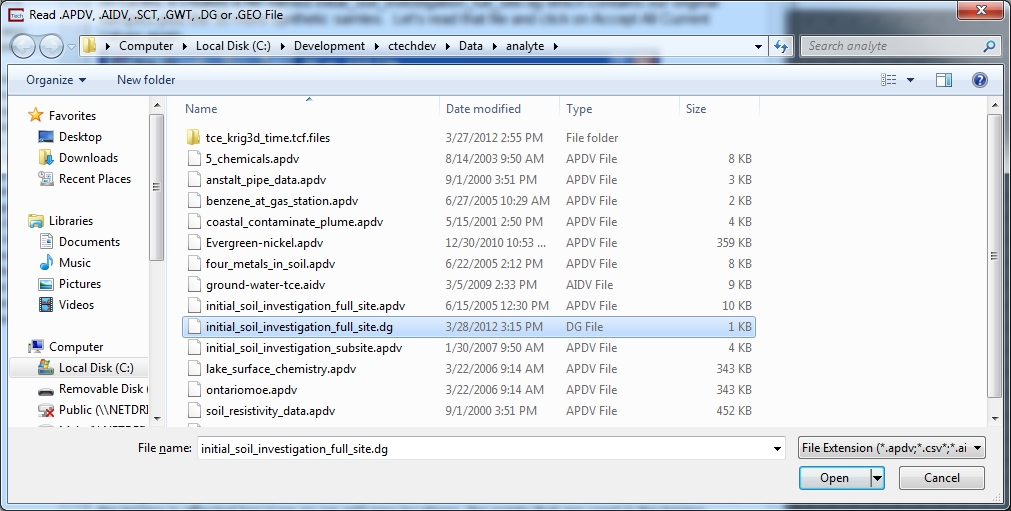
Now let's analyze the quality of fit after our 30 cycles. Since our last DrillGuide© run was set to run for 30 cycles, it created a file named initial_soil_investigation_full_site.dg which contains our original samples plus the 30 more synthetic samles. Let's read that file and click on Accept All Current Values again.
Note that the general distribution has not changed dramatically, but the nominal area has increased. Although each predicted (synthetic) sample has a concentration that matches the predicted values, the kriging is affected because as we add new locations, the points that are used in the kriging algorithm are affected.
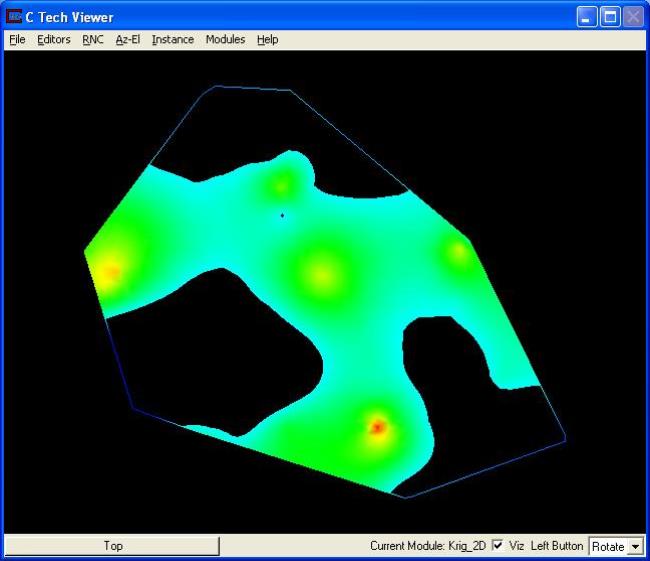

Our nominal affected area is now 375,701.9 sq. ft.
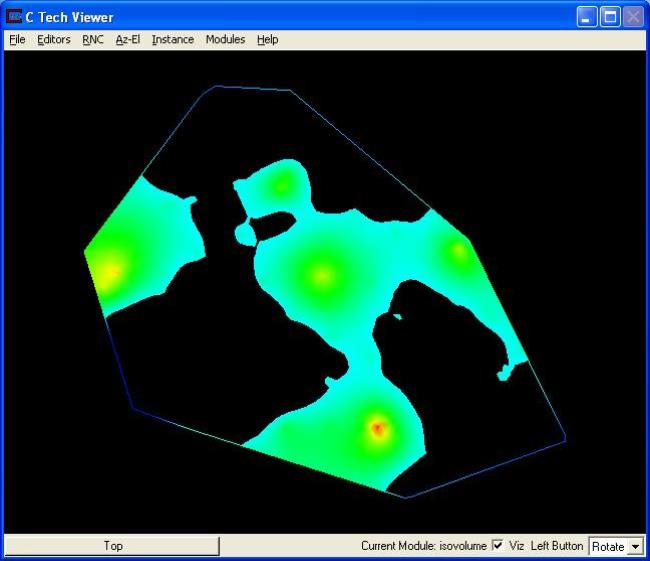
If we switch to display minimum it will show:

And the maximum affected area is:
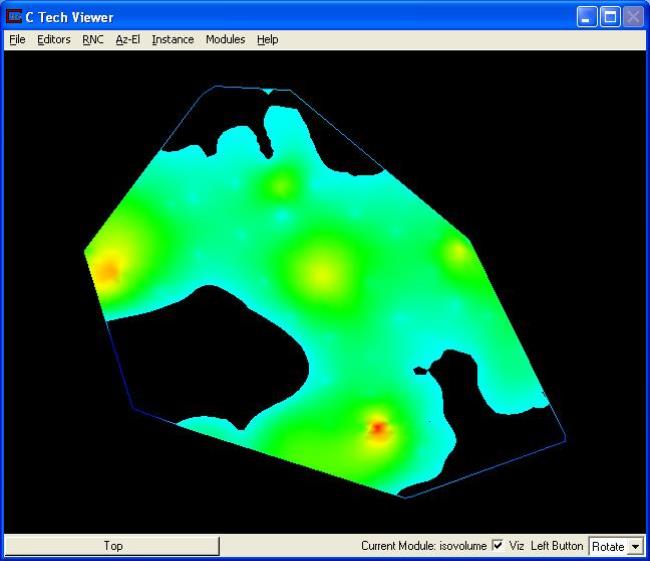

Clearly we would like a ratio of 1.0, which would signify that there is no variation in the statistically determined contaminant area. The reduction to 1.89 represents a significant decrease.
|
Nominal area |
375701.9 |
Deviation |
|
Minimum area |
266852.06 |
-29 % |
|
Maximum area |
477056.03 |
27 % |
|
Max / Min area ratio |
1.79 |
|
The most logical way to assess our improvement is to look at the reduction in deviations between nominal and min or max. Ideally we would like deviations of zero (0.00%). What we are seeing is a reduction in Min deviation of 41% and reduction in Max deviation of 46%. Given that there were 99 borings initially and we have only added 30 synthetic borings, this is a significant improvement.
Clearly, a ratio of 1.79 for the largest to smallest expected plume area is excessive and still probably quite unacceptable.
To demonstrate that additional improvement is possible, we will run a total of 75 Drill Guide Cycles.
Open the Kriging Parameters window and switch back to Statistics.

We also need to set our Drill Guide settings back to where we had them before. Open the Drill Guide window and turn on the Run Drill Guide and Target Concentration at subsetting level toggles. Also verify that the Target Concentration is set to 0.1 and set the number of Drill Guide Cycles to 75.
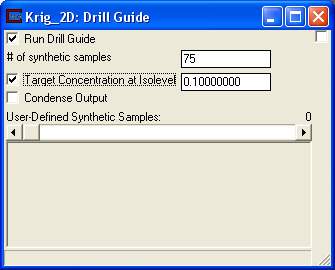
Be sure to select the original input data file initial_soil_investigation_full_site.apdv and click Accept All Current Values.
Once all the cycles have run, the (*.dg) data file created (initial_soil_investigation_full_site.dg) will automatically be the selected file. Switch the Kriging Parameter's option back to Min-Max Plume. Also, we will need to turn off the Run Drill Guide and Target Concentration at subsetting level toggles in the Drill Guide window..
Remember to click on Accept All Current Values one last time.

Disconnect Krig_2D's red port from the Viewer. Also, change plume_area back to displaying the nominal plume and set the Exponentiated Level to 0.1. After running the 45 additional cycles the Nominal area display should be:
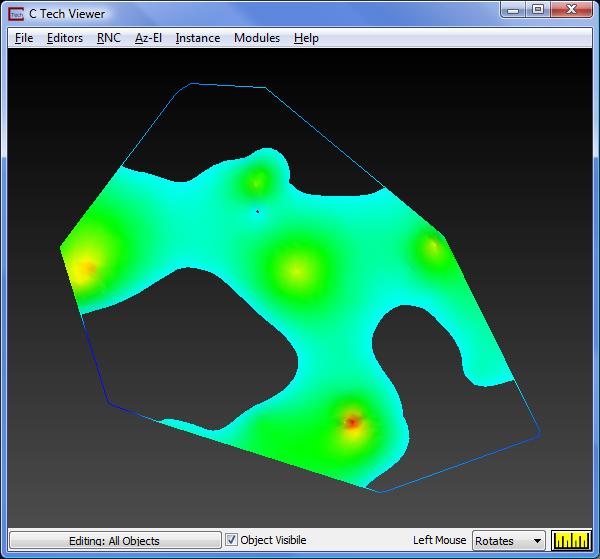

The Minimum area display should be:


and the Maximum area should be


|
Nominal area |
371091.28 |
Deviation |
|
Minimum area |
307840.25 |
-17.0% |
|
Maximum area |
433038.78 |
16.7% |
|
Max / Min area ratio |
1.41 |
|
Originally we had 43 samples. We now have 75 additional synthetic samples for a total of 118.
Once again, we can estimate the average spacing between our borings by taking the square root of: the total domain area divided by the number of borings. The square root of the total site area of 669,690 sq. ft. divided by 118, yields an average spacing of 75 feet (down from 125).
We have reduced the average spacing by 40% and achieved a substantial reduction in area variation.
© 1994-2018 ctech.com