In addition to displaying the location of Max Uncertainty, which is the suggested location for a new sampling event, DrillGuide© can create a data file with the synthetic samples added.
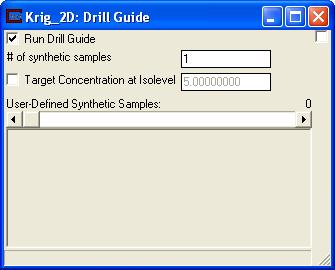
We will begin by closing the Display Settings window in Krig_2D and opening the Drill Guide window. Turn on the "Run Drill Guide" toggle as seen in the image below.

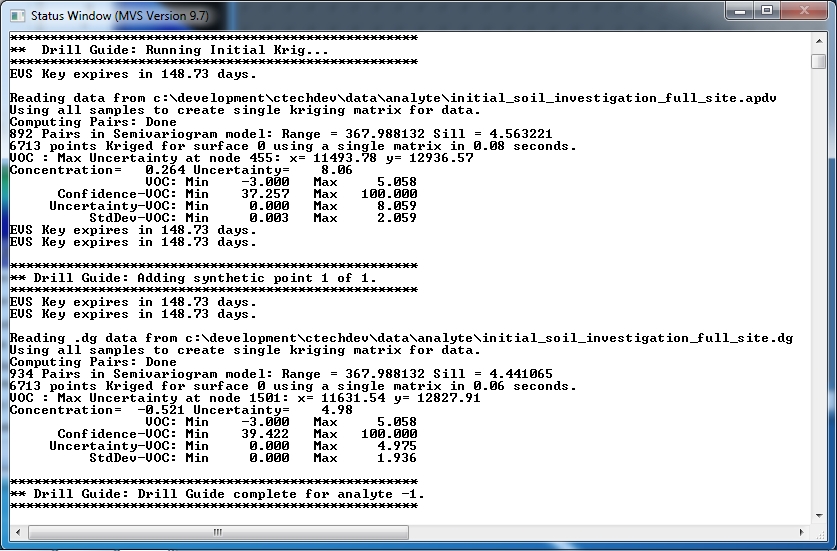
Now choose "Accept All Current Values" in the main Krig_2D window. Krig_2D will now run, and display a different set of output from before.

When a drill guide cycle is run, it creates a new data file (*.dg) that contains a synthetic sample. Each cycle adds one new synthetic sample. Below is a list of the file initial_soil_investigation_full_site.dg that was created from this first cycle. Note that the new sample is at the bottom of the file
"initial_soil_investigation_full_site.apdv" -1
11491.566406 12935.902344 0.000000 1.664481 "new_1[0]"
This sample has the same x-y coordinate and predicted concentration as the Maximum Uncertainty Location. The z coordinate assigned to 0.0.
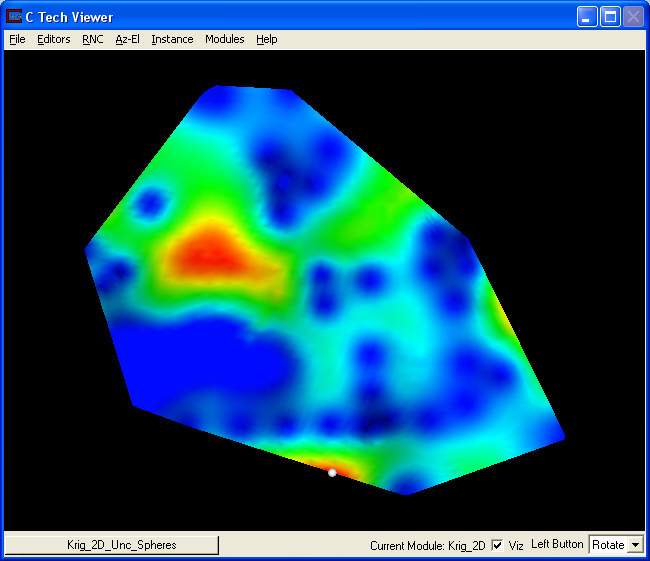
When we ran, notice that the Viewer's picture updated as well. The large red region which used to contain our small grey sphere is now blue, and two new red regions have appeared.

Your Viewer should look like the picture above. Notice now that the new location of Max Uncertainty lies far away from the original location. Probe the sphere with your Alt+Left Mouse Button.

If you switch the Data component in the Display Settings back to confidence, you will be able to clearly see that the confidence is now high in the location where the synthetic sample was located.

© 1994-2018 ctech.com