Krig_3D_Geology is the primary module for creating three-dimensional models of geologic structures. In the following topics we will create a model of complex geologic structures.
First, let's start our copy of EVS. We will then instance Krig_3D_Geology, which is the first module in the File sublibrary.

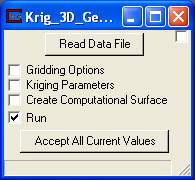
Double click on the Krig_3D_Geology module in the Application area and the following window should appear on your screen.

The Krig_3D_Geology module uses kriging to interpolate and extrapolate between borings to create a continuous geologic surface. Let's go through some of the parameter options for this module and then we will select a file and run the module. For this workbook, we will look at the Gridding Options and some of the Kriging Parameters.
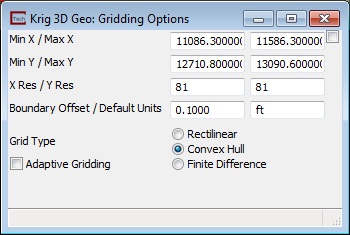
Select Gridding Options and the following window should appear. This window has the most commonly changed parameters and many of these parameters affect and override settings in downstream modules. The parameters with values of 0.0 are automatically filled in by the expert system during the kriging process if they have not been changed. Leaving these at their defaults will typically provide good results.

The first four parameters define a rectangular region which is the "Rectilinear" domain (in the x-y plane). These parameters will be automatically defined by your geology data file if the defaults are used. These values are ignored if Convex Hull (default) is used.
X Res and Y Res are the most commonly changed parameters. These determine the resolution of the grid in the x-y plane. The default values of 41x41 give a reasonably fine model, but higher resolutions are generally used for final analyses. Remember that the compute time and system resource requirements are dependent on the product of the x, y, (and z) resolutions.
Boundary Offset is the convex hull boundary offset. This is similar to the offset concept in AutoCAD (tm). It extends the domain beyond the convex hull of the sample locations by a percentage of the x-y extent. A value of .1 puts an offset of 10% of the extent on all sides.
Grid Type: This is another commonly changed parameter. Rectilinear provides a domain with a grid which is composed of uniform sized rectangles and has straight sides. Rectilinear also allows for subsetting or extending the domain with the Min/Max X/Y parameters. Convex hull confines the kriging (domain) to a region defined by the sample locations. Finite Difference provides a domain with a grid which can be composed of variable sized rectangles and has straight sides. This type of grid can also be rotated to any x/y orientation.
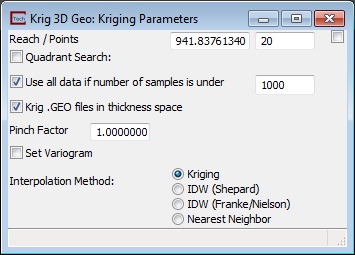
Now open the Kriging Parameters window as shown below.

Reach defines the distance from a kriged point to all data samples which will be used in the matrix solution. Larger reaches will produce smoother distributions.
Points is the maximum number of samples points which will be considered in the matrix solution when predicting the value at a node location. Larger numbers will produce smoother distributions, but dramatically slow down the kriging process.
Now that we have discussed these parameters, close the Kriging Parameters window. We will leave all of the default settings for this workbook.
Read adatafile:
a. Go back to the main menu window (labeled Krig_3D_Geology) and close all open subwindows (those with the toggle checked) by clicking on any that have an check mark.
b. Select the Read DataFile button.
c. Select initial_soil_investigation_subsite.geo from the Files list box.
d. Select the Open button.
e. Select the Accept All Current Values button.
Krig_3D_Geology reads the geology data and begins the kriging process. In less than one minute, it calculates the surfaces for the grid we selected. While it runs, Krig_3D_Geology prints messages to the console such as percentage completion. When it is done, the console messages look like this:
OM(Root) -> File check passed
File check passed
Reading .geo data from c:\ctech\data\geology\initial_soil_investigation_subsite.geo
*** Surface 0 ***
Computing Pairs: Done
276 Pairs in Semivariogram model: Range = 895.126556 Sill = 14.029811
1681 points Kriged for surface 0 using 85 matrices in 0.00 minutes
*** Surface 1 ***
Computing Pairs: Done
276 Pairs in Semivariogram model: Range = 166.578261 Sill = 4.763116
1681 points Kriged for surface 1 using 85 matrices in 0.00 minutes
*** Surface 2 ***
Computing Pairs: Done
276 Pairs in Semivariogram model: Range = 173.335077 Sill = 7.211553
1681 points Kriged for surface 2 using 85 matrices in 0.00 minutes
*** Surface 3 ***
Computing Pairs: Done
276 Pairs in Semivariogram model: Range = 156.972936 Sill = 3.352522
1681 points Kriged for surface 3 using 85 matrices in 0.00 minutes
*** Surface 4 ***
Computing Pairs: Done
276 Pairs in Semivariogram model: Range = 156.972936 Sill = 7.062694
1681 points Kriged for surface 4 using 85 matrices in 0.00 minutes
*** Surface 5 ***
Computing Pairs: Done
276 Pairs in Semivariogram model: Range = 1236.354406 Sill = 8.695820
1681 points Kriged for surface 5 using 85 matrices in 0.00 minutes
Layer 1 is Fill with material color 2
Layer 2 is Silt with material color 1
Layer 3 is Clay with material color 3
Layer 4 is Gravel with material color 5
Layer 5 is Sand with material color 4
Krig_3D_Geology produces a grid (in the x-y plane) and maps the geologic surfaces defined in the input file to that grid. Its output is a set of surfaces, one for the top ground surface and one for the bottom of each geologic layer in the domain.
This one module network is not yet particularly interesting. Note that one of the output ports for this module is tri-colored and different than anything we used in Workbook 1. We need to find modules which can receive this output in order to process and display the results of this module.
© 1994-2018 ctech.com