Krig_3D has produced a finite element model with the chemical concentrations of the input file mapped to a regular grid. From this model, we can quickly create a visualization of the contaminant plume. All we need to do is replace the external_faces module with plume_shell and add external_edges. Your network should look like the one below.
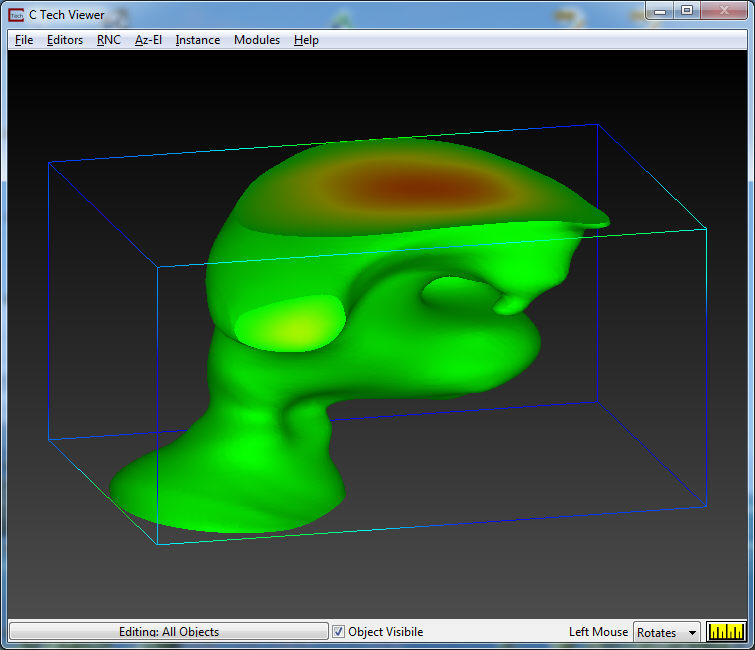
Since our data was clipped at 0.001 ppm minimum (log10 value -3) and 1000.0 ppm maximum (log10 value 3) the initial subsetting level will be set to 1 ppm (log10 value of 0.00 zero) which is the midpoint.

If you set your Elevation to 15 degrees, Scale to 1.0 and choose 195 degree Azimuth, your view should look like this:
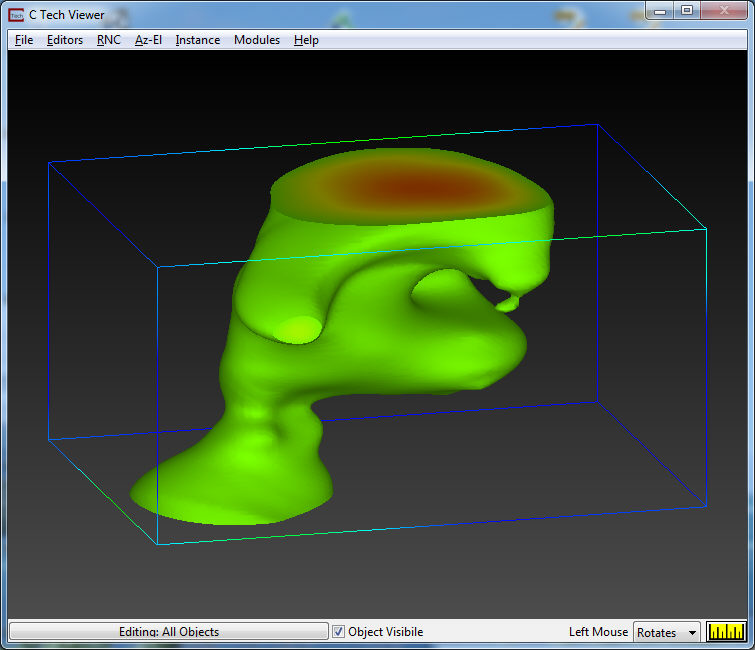
You can adjust the SubsettingLevel to any value between the minimum and maximum values in your data. Open plume_shell’s window and set the SubsettingLevel to 5.0.
Your Viewer should now show:
© 1994-2018 ctech.com