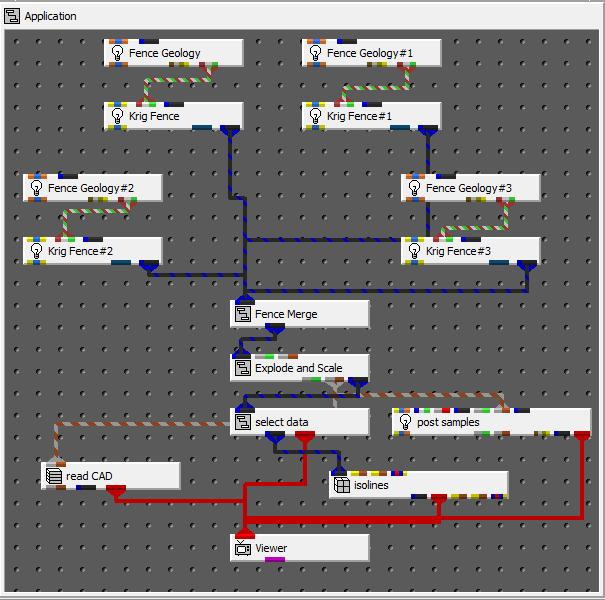
Now we will post our measured data as spheres, overlay a drawing showing building outlines and add isolines to the fences. Add three new modules to your network to match:

We will start with adding spheres and boreholes corresponding to our measured data. We have already used the post_samples module in previous workbooks, so we won't cover its options in detail.
The first thing we will do is read the .apdv file which contains all four fence section data samples. Choose Load File in post_samples and select four_fences_all_fences.apdv in the fence folder.
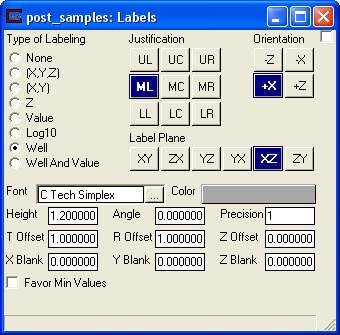
Now activate the Labels window of post_samples and choose the 'Well' option for Type of Labeling, as shown below. Also, set the label height to 1.2.

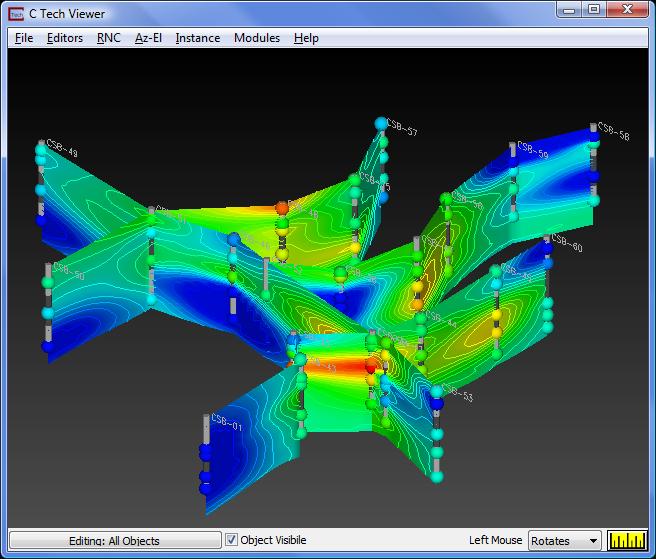
Click on the multi-colored (Reset/Normalize/Center) button in Azimuth & Elevation to achieve a view like this:

© 1994-2018 ctech.com