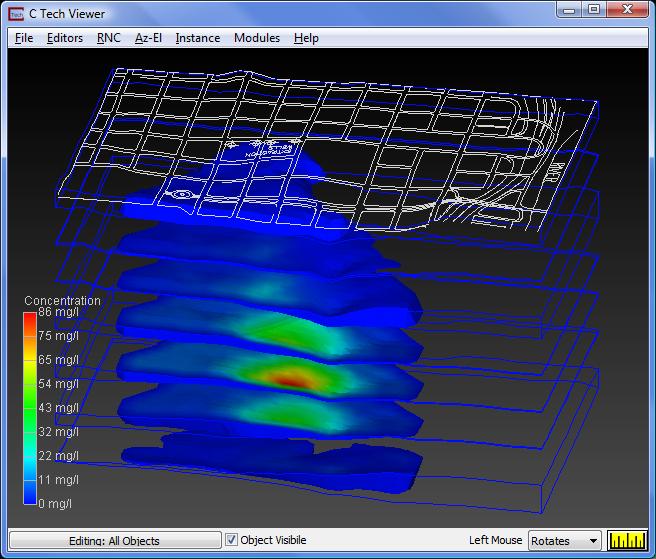
Visualization of the MT3D simulated contaminant plume can be done using the application built in the previous section of this workbook. The MT3D simulation has already been run and the results have been appended to the UCD (multi_layer_modflow.inp) currently being used. The first seven (all scalar) components were written by a MODFLOW simulation. Concentration, Change in Conc(entration) and Velocity (a 3 component vector) were created by MT3D and were appended to the same UCD. To visualize the MT3D results we merely select any of those data components appended by MT3D.
To visualize the concentration:
1. Open external_edge's panel and select Concentration as the Nodal DataComponent.
2. Open the plume_shell control panel. Change the SubsettingComponent to Concentration. Then uncheck "Drawdown" and check on "Concentration" in the Nodal Data to Output. This will cause us to color our output by Concentration (the first mapped component). Finally, set the subsetting level to 0.1 ppm. Please note that MT3D does not output concentrations on a log10 scale. All values are actual linear values. They could be converted to log10 values using the data_math module if desired.
When you hit enter or move the cursor (and click it) it notifies this window that the value has changed. If you know that you don't want to change it immediately it is always faster to click in another window, because if you hit enter, plume_shell recalculates... and it will recalculate again when you move your cursor, click the mouse or close this window.
The view in the viewer now displays a volumetric subset of concentrations greater than 0.1 mg/l. Notice that the legend automatically updated to show the correct data component and units.
Set your view (Az-El) parameters to Scale = 1.2, Elevation = 25, and Azimuth = 15. The image in the viewer now shows a volumetric subset of the Concentration greater than .1 M/L^3 and an overlay of the site basemap.

This plume_shell of concentration displays all concentrations greater than 0.1 mg/l. Because the MT3D example problem incorporates dispersion, the higher concentrations will occur at the center of the isovolume. In order to see inside the contaminant plume we will next add a cut plane vertically through the plume.
© 1994-2018 ctech.com