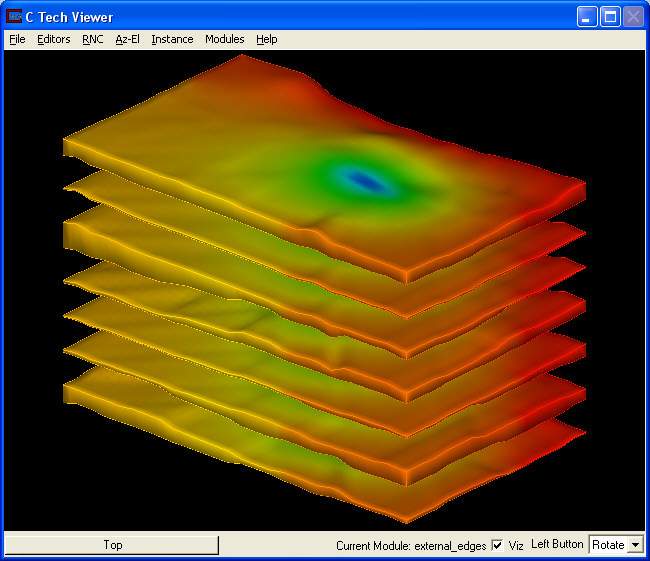
First, return the Modes settings for external_faces to their original values, reconnect external_edges to the Viewer and set external_edges to have a Max Edge Angle of 60. If you hit the Reset/Normalize/Center (multi-colored) button in Az-El, the display of the surfaces colored by head should now be:

Note the center region with low heads. The default color map results in low head values colored blue and high head values colored red.
Visualize Heads
To visualize a volumetric subset of Model calculated heads:
1. Modify your application by replacing external_faces with plume_shell.
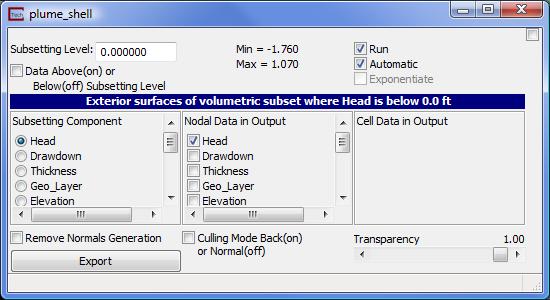
2. Open plume_shell's control panel and set the subsetting level to 0.0 and turn off the Above toggle.
The viewer display should now look similar to this:
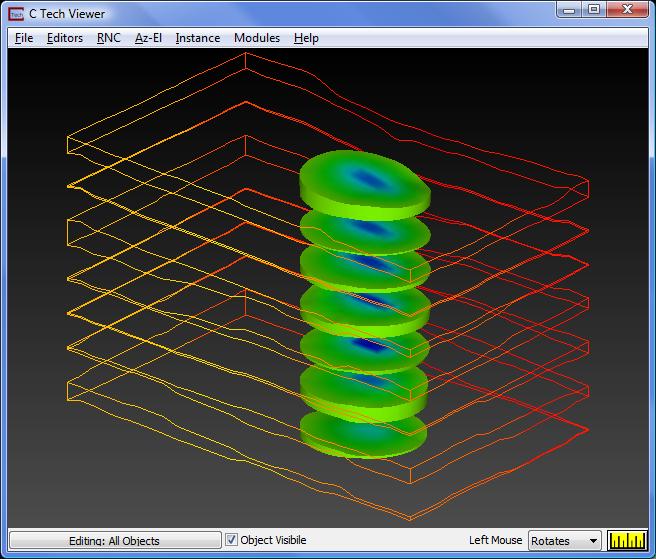
This display shows a volumetric subset of all regions in the model where head is below 0 feet. These areas are clearly affected by one or more wells.
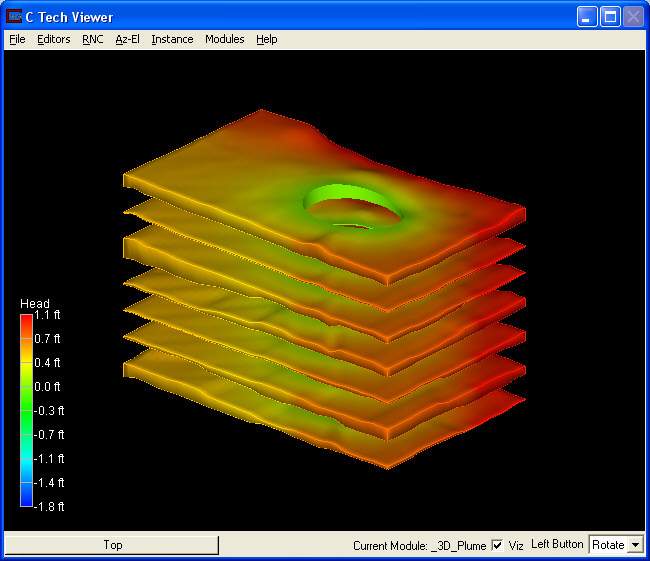
Turn on the Above toggle so the display shows all regions in the model where head is above 0 feet. and let's also add a color legend. To do this:
1. Instance the Legend module
2. Connect the output port (red) on plume_shell to the (red) input port on Legend and connect the output port (red) on Legend to the Viewer's (red) input.
You'll notice the legend appears in the lower left corner of your screen. The units (ft) and data component (Head) are automatically pulled from the output of plume_shell and populated in the Viewer.
Visualize Drawdowns
We will now take a look at the calculated drawdowns. Drawdown in MODFLOW actually means change in head since the start of simulation. Models incorporating area or point sources can actually have negative values of drawdown (Drawdown is positive for declining water levels).
To visualize drawdown:
1. Open the external_edges control panel and set the data component to drawdown.
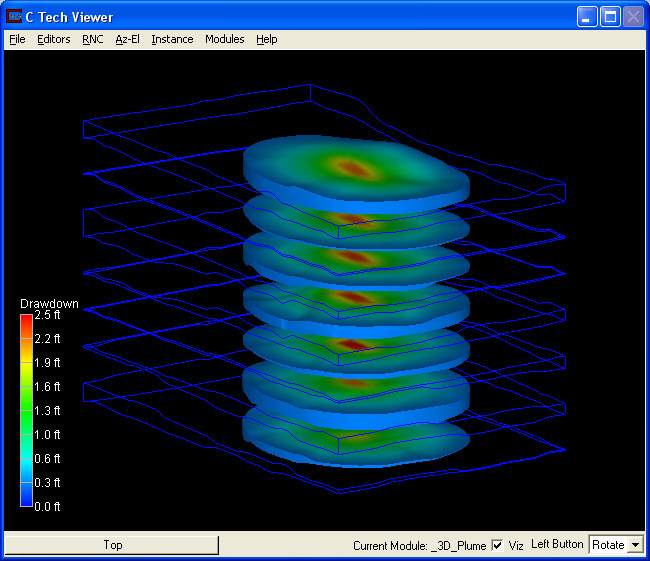
2. Open the plume_shell control panel and set the subsetting level to 0.3, the SubsettingComponent to Drawdown, and make sure that "Drawdown" is the only selected data under Nodal Data in Output. (You will need to uncheck "Head" and check on "Drawdown" in Map Components.)
3. Set your view (Az-El) parameters to Scale = 1.10, Elevation = 15, and Azimuth = 150. The display in the viewer now shows all drawdowns greater than 0.3 feet. For this model the drawdown distributions are similar in all layers, but note the brightest red (high drawdown) location is in the center layers. This center region is the location of wells in this model.
© 1994-2018 ctech.com