When is a site sufficiently characterized? This is a difficult question. Sometimes the answer is simple...when the money runs out. The real answer obviously depends on risk assessments, remediation plans and other social and political factors. This Min-Max Plume technology in EVS (This feature is only available in EVS-Pro and MVS) offers a quantitative and justifiable method of deciding when enough is enough.
The first step should always be a risk assessment. Depending on the toxicity of the contaminants, the location of the plume relative to the water table, wells etc., and many other factors, a confidence level should be selected. Reasonable values might range from 60 to 95%.
We can use that confidence level to compute the volumetric variation between the minimum and maximum three-dimensional plume that is predicted with the available site data. Based on the variations and/or the predicted minimum and maximum values, site assessment quality can be directly assessed.
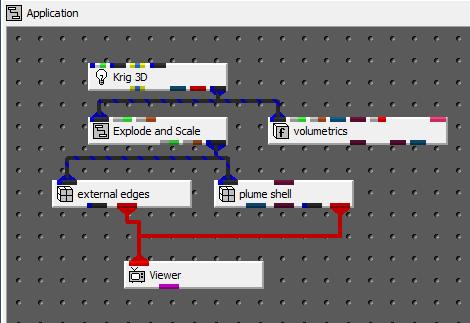
Let's look at an example of an under-characterized site. Construct the following network and choose the file initial_soil_investigation_subsite.apdv for Krig_3D.

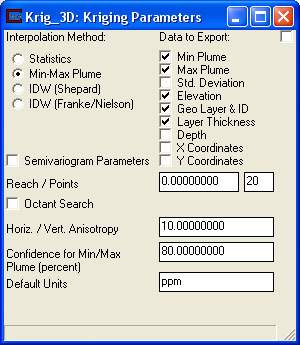
Bring up the Kriging Parameters and adjust it to match the figure below. Make sure to select Min-Max Plume and set the Confidence to 80%.
Close Kriging Parameters and click on Accept All Current Values to run Krig_3D.
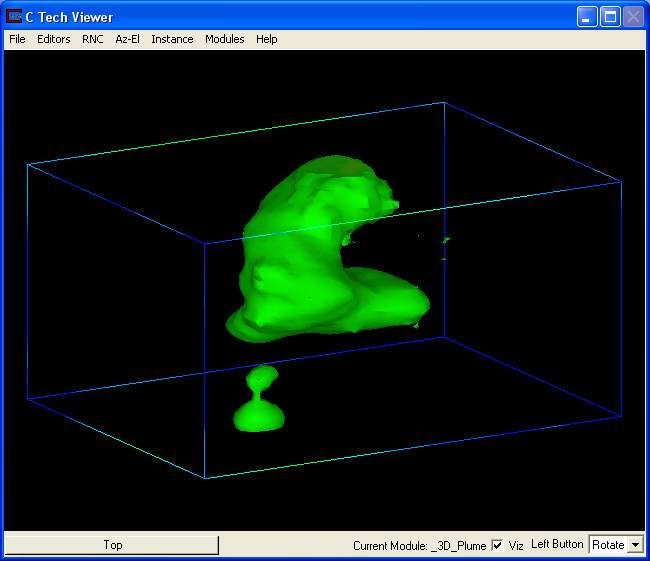
Bring up the Az-El panel and set Scale = 1.00, Elevation = 15, Azimuth = 210. Open the plume_shell panel and set the subsetting level to 1.0 (or Exponentiated Level to 10 ppm). Also set both the Iso Component and Map Component to 80%Min:TOTHC. For the Map Component, multiple data components can be selected for output. Only the first component checked will be used for coloring the output. Make sure that only 80%Min:TOTHC is selected. When you're done, your minimum plume should look like the figure below.
Minimum Plume:
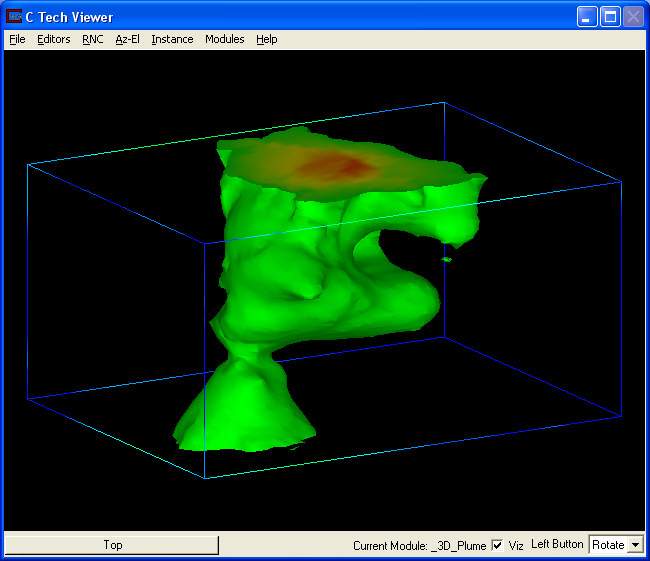
If you set the plume_shell Iso Component and Map Component both to TOTHC, your nominal plume should look like this. Note that it is both dramatically bigger and has much higher concentrations in the center at the top surface. One surprising fact is that both of these plumes honor the measured data samples. The variations are occurring in the regions between samples. Obviously if we had more samples, we would have less variation. The quality of our site assessment is becoming more obvious.
Nominal Plume:
Set both the Iso Component and the only Map Component to 80%Max:TOTHC to see the maximum plume. Note again how much higher the concentrations are at the boundaries of the domain, and how much bigger this plume is. Again, this plume will honor our measured data. Sometimes this can result in a plume with interior cavities (surrounding low concentration measured samples. We could check for these using either transparency or by cutting through this plume with a cut module. We will leave that exercise for the student.
Maximum Plume:
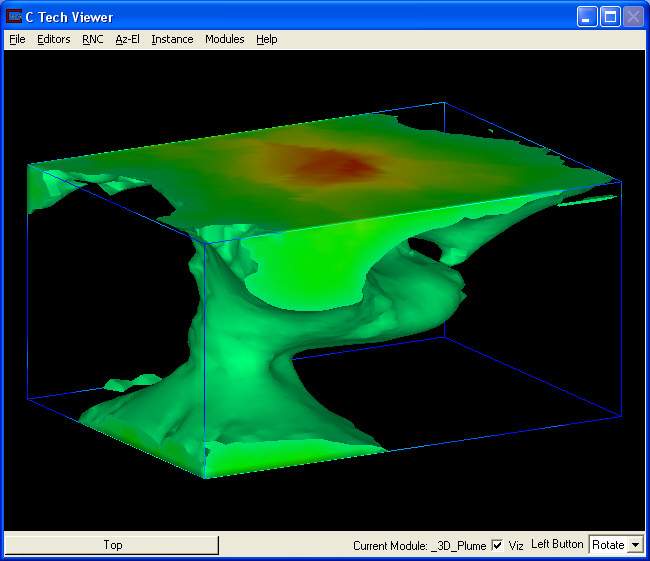
The pictures are useful and can obviously be enhanced with posted data, color legends, axes, overlay drawings, etc. Now let's look at how we determine the Min and Max values at each node.
Note: for the three images above, different Max values result from the kriging, therefore the colors above do not exactly correspond to the same concentrations in all pictures. This could be fixed by clamping the max values (Post-Clip_Max) or using a set_minmax module before plume_shell.
© 1994-2018 ctech.com