At first glance, confidence seems to be a reasonable measure of site assessment quality. We know that if the confidence is high, we can be assured of the reasonableness of the predicted values. You might be tempted to collect samples everywhere that the confidence was low, and if you did, your site would be well characterized.
But, there is a better, more cost-effective way. Instead of focusing on every place where confidence was low, we could focus on only those locations where there was low confidence and where the predicted concentration was reasonably high. We could try to see these locations by looking at the confidence colored plot for high elevation areas...or, we could use the EVS measure called uncertainty. In EVS, uncertainty is high where concentrations are predicted to be relatively high (above the Clip Min), but the confidence in that prediction is low. If the goal is to find the contamination, using uncertainty will allow for more rapid, cost effective site assessment.
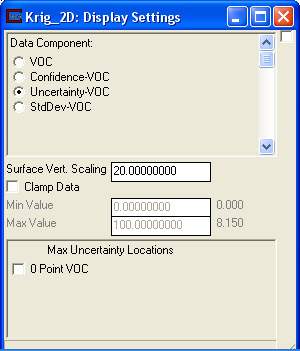
Let's look at the Uncertainty plot. Choose Uncertainty as the Data Component and turn off the Clamp Data toggle. Note that it ranges from 0.00 to 8.15.

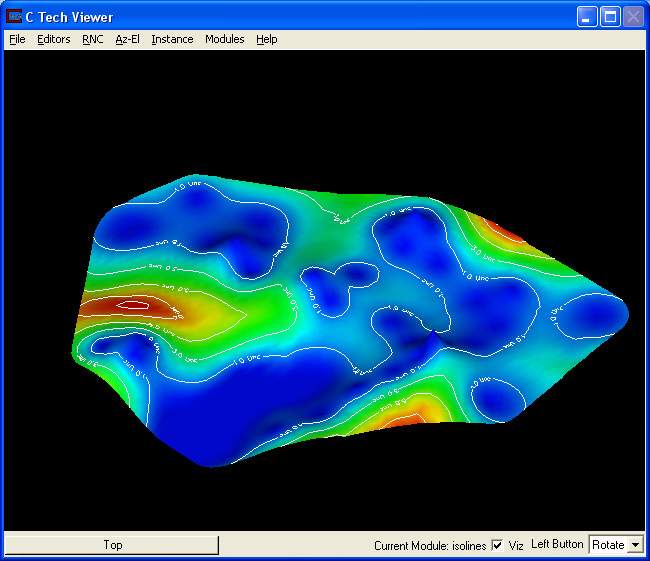
When we ran this calculation, the EVS Status Window reported the precise coordinate of the maximum uncertainty. That location is a very appropriate next sampling site.
VOC : Max Uncertainty at node 388: x= 11512.49 y= 12921.77
Concentration= 0.223 Uncertainty= 8.15
Note the bright red spot (dark spot in black & white) on the left side of the domain. This area is far from any sample locations (regions of high confidence) and it is on the side of our topological hill (meaning that the concentration is well above our minimum. To make the region more obvious in the printed book, we have added labeled isolines (This feature is only available in EVS PRO) at uncertainty value of 1, 3, 5, 7, and 8.

Uncertainty does not have physical units, rather it is a dimensionless parameter for which higher values are bad and lower values are good. High uncertainty means a high probability of poorly characterized contamination. Low uncertainty means a low probability of uncharacterized contamination. The function used to compute uncertainty has been optimized to minimize the number of new sampling locations required to lower the maximum uncertainty anywhere in the model domain to a specific low value. The confidence levels and corresponding uncertainties are data dependent. If the measured data has regions of high concentration gradient, nearby areas away from sample locations will have lower confidence and higher uncertainty.
The absolute magnitude of uncertainty values is also dependent on three key user specified values; the confidence interval, and the display clipping minimum and maximum. The "clip min" establishes the floor for concentration values. Values below this level are considered unimportant (or more specifically, they are set to that level). The "clip max" establishes the ceiling for concentration values. Values above this level are clipped to this value. Setting the clip max at the concentration value of most interest, such as the toxic level for a plume boundary, will cause the selection of new sampling locations to converge most rapidly on defining the plume boundary. This will however sacrifice the accurate characterization of the most contaminated regions in the domain. This limitation is generally acceptable if the primary goal is determination of the extent (rather than specific distribution) of contamination. A superior approach is to use the DrillGuide© technology documented in the previous workbooks to target the characterization of a specific concentration of interest.
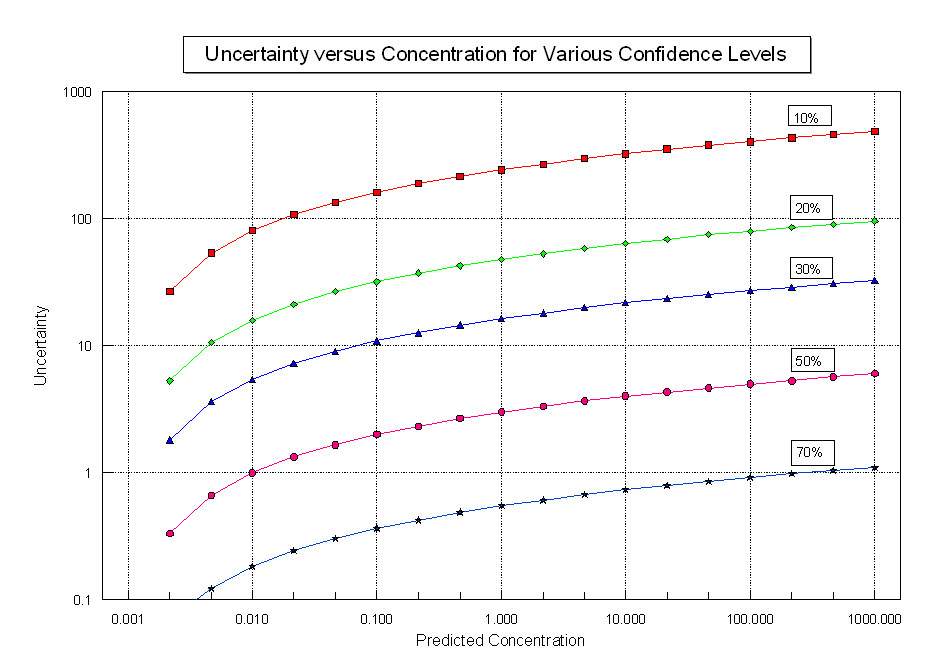
The next figure shows the calculated uncertainty as a function of predicted concentration for 5 different confidence levels. This plot assumed a clip min of .001, and clip max of 1000, and a confidence interval of 10. During the early stages of site characterization uncertainty levels can exceed 100.

© 1994-2018 ctech.com