![]()
This is a deprecated module that has been supplanted the intersection module or the use of two plume_volume modules.
General Module Function
contour is similar to plume_volume in that it subsets both 2D and 3D input fields, but it provides the additional ability to specify minimum and maximum contour levels and outputs only those regions falling in between.
Module Input Ports
contour has three input ports. The leftmost port accepts unstructured mesh data. The other ports provide a means to share the subsetting levels of other modules.
Module Output Ports
contour contains four output ports. The first output port (far left) outputs a new unstructured mesh which contains cell type tri(angle) representing the external faces of the contour. Nodal data sent to this output port consists of the nodal data of the map component within the contour level. The second port outputs a rendered geometry directly to the Viewer. The third and fourth output ports provide a means to share the subsetting levels of this module with others.

Module Control Panel
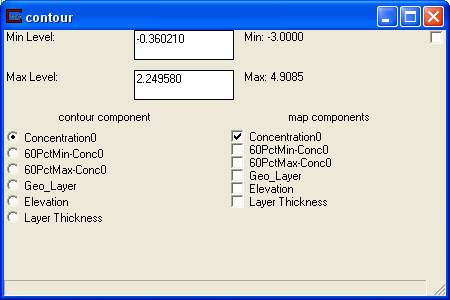
The control panel for contour is shown in the figure above. The left column, labeled contour component, consists of a series of radio buttons representing all available model data components. The right column, labeled map components, is a series of check boxes next to the same model data components. User input sliders labeled min level and max level are displayed above the contour component radio buttons. At the right ends of the sliders the minimum and maximum values for the data selected under iso component are displayed.
Iso component refers to the nodal data used to create the data subset. When an iso component is selected, the min and max values of the variable are displayed at the right end of the min and max level sliders. The default iso component is the first (0th) component in the column.
Map component determines which data components will be sent to the leftmost output port in an unstructured mesh format. Note that the first map component selected will be used to color the contour, regardless of how many others are selected. For example, choosing iso component concentration and map component uncertainty will create an contour of concentration colored by uncertainty. By default, only the first map component is selected.
The min and max level sliders are used to define the iso component value at which the subset defined by contour is to be drawn. If a value is chosen larger than the max value, the max value is placed in the edit box. Similarly, if a value less then the minimum is input, the minimum value is placed in the box. The default level values are 1/3 and 2/3 of the way between the minimum and maximum values for the selected iso component.
Related Modules
-> isolines
-> plume_volume
© 1994-2018 ctech.com