![]()
General Module Function
The axes module is used to place 3D axes in the viewer scaled by the model data and/or user defined limits. Axes accepts data from many of the Subsetting and Processing modules and outputs directly to the viewer. Data passed to Axes should come from modules which have scaled or transformed the mesh data, for example Explode_and_Scale. Axes generated by axes and displayed in the viewer are transformable with other objects in the viewer.
The User interface to axes is very comprehensive. Each coordinate direction axis can be individually controlled. Axis labels and tick marks for each axes can be specified. The label font, label precision, label orientation, and other label parameters are all user specified. Many of the parameters do not have default values that will produce the desired results because many variables control how the axes should be defined.
axes requires a field input to position and size the axes. If you disconnect the (blue/black) field input port, you no longer lose the axes bounds values and your axes remain in place. This is useful when field data changes in an animation so that you don't constantly recreate the axes.
Also, the size of text and tick marks is based on a percentage of the x-y-z extent of the input field. This now allows you to set the extent of one or more axes to zero so you can have a scale of only one or two dimensions.
Module Input Ports
The axes module is shown above. The module has five input ports:
Module Output Ports
axes has one output port which sends the axes to the viewer for display.
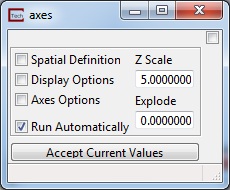
Module Control Panel
The main control panel for axes is shown above. The control parameters are divided into three panels, each made visible by toggles on this main panel.
Spatial Definition
Display Options
Axes Options
The sections below discuss each of these panels.
Spatial Definition
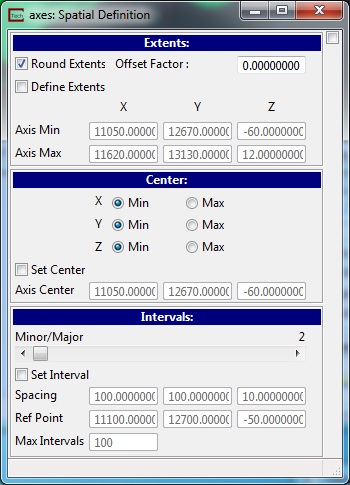
Normally the extents of your axes are determined by one or more modules connected to axes’ blue-black and/or red input ports. However there are options that allow you to modify this behaviour. The options include:
Round Extents increases the extents of the model to have the labeling start at logical coordinates rounded down at the minimum of x, y, & z and rounded up at the maximum.
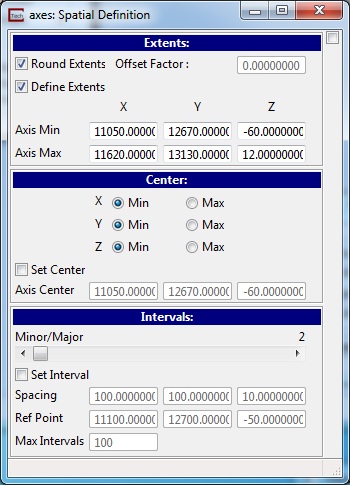
Define Extents allows you to specify any extents you wish instead of having the extents determined by module inputs.
Offset Factor is a fraction (of your total extents) to offset the extents beyond the data extents. At 0.1 it would make axes 10% bigger in all directions.
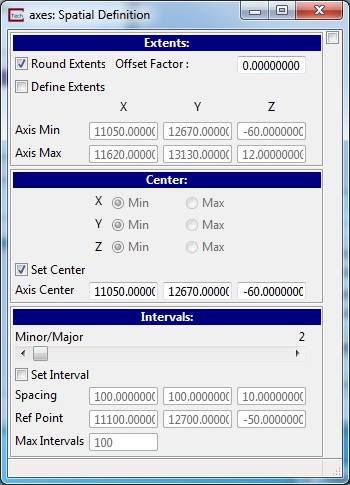
Set Center allows you to specify any center you wish instead of having the center determined by module inputs and Min/Max radio selectors.
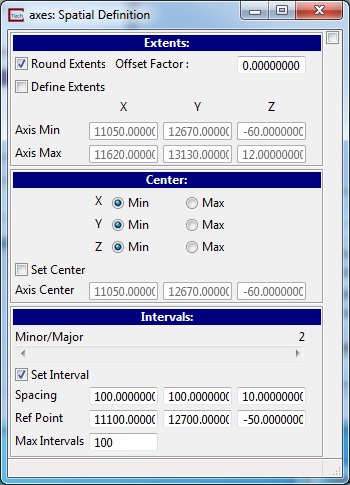
Set Interval allows you to override the expert system's tick spacing, reference point, and the maximum number of intervals.
Minor/Major is a slider to determine how many minor intervals for every major interval.
Display Options
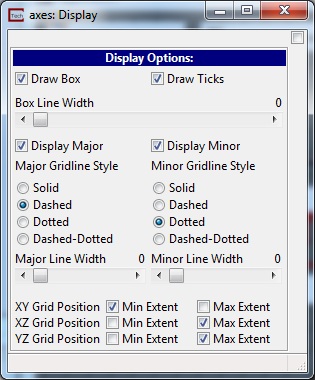
The display options control several aspects of the appearance of the axes, tick marks, lines, boxes and more.
The DrawBox check box is used to specify if the axes should be drawn as a box around the data domain or as single X, Y, and Z lines.
Box Line Width determines the thickness of the box lines. 0 (and 1) give a single pixel wide line and larger numbers give wider lines. Note that only odd numbers 1, 3, 5, etc. are supported by the Software Renderer.
The Display Major and Display Minor check boxes are used to specify whether the tick marks and labels are displayed (on) or not (off). Both are on by default.
Major (and Minor) Gridline Style allow you to specify the line styles for the gridlines.
Major (and Minor) Line Width determines the thickness of the gridlines. 0 (and 1) give a single pixel wide line and larger numbers give wider lines. Note that only odd numbers 1, 3, 5, etc. are supported by the Software Renderer.
The remaining 6 toggles allow you to specify which planes of the axes should have gridlines.
AxesOptions
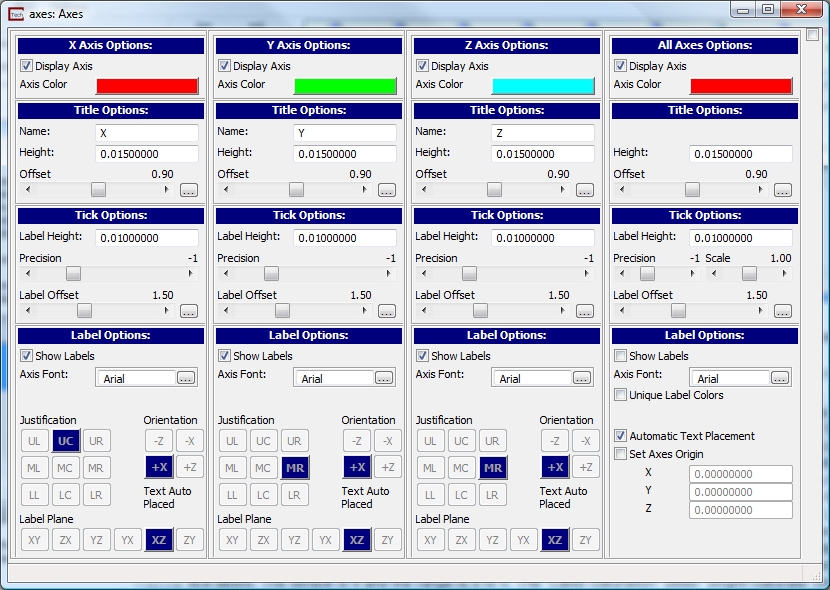
This panel has 4 subpanels that provide control over X, Y, & Z axes and an option for ALL. When parameters are modified in the All subpanel, the corresponding parameter in the X, Y, & Z axes are all modified.
These axis variable control panels consist of check boxes, edit fields and sliders all used to control the display of axes and labels
Under X (Y, Z or ALL) Axis Options:
The Display Axis toggle determines if that axis is displayed.
The Axis Color button lets you set the color for that axis. To have uncolored axes, merely change the All color button to white, black or any other color.
Under Title Options:
the Name edit field is used to specify the text that will appear as the axis label for the axis being edited. The default is the Cartesian axis specifier for the axis being edited (For example, X for the X axis). This label can be any text string and can contain spaces and special characters.
Height is the height of the Name field as a percentage of the total axes extent.
Offset is a distance to offset the Name from the corner of the axes box.
Under Tick Options:
LabelHeight is the height of the Name field as a percentage of the total axes extent.
Precision is an integer slider that determines how the tick positions (numeric values) will be determined. For values of zero and larger it determines the number of decimal points. If this number is negative, the function attempts to automatically determine the optimal number of decimal points to use based on the value. By changing this negative value, you can control the number of decimal points used in the automatic conversion.
Scale affects the relative size of the Tick marks and the label offsetting.
Label Offset is a distance to offset the Tick label from the end of the tick mark.
Under Label Options:
1) The Justification push buttons are used to set the location of the label relative to the end of the tick mark to be labeled. The layout of these push buttons corresponds to the location of the tick mark relative to the labels location. The label can exist in any of nine locations relative to the tick mark. For example:
- Selecting MC (middle center) the center of the label is placed directly over the end of the tick mark.
- Selecting UC (upper center) places the center of the label directly below the end of the tick mark (tick mark is above the center of the label).
- Selecting LL (lower left) places the left end of the label just above the end of the tick mark.
- Selecting MR (middle right) places the right end of the label directly to the left of the tick mark.
The other justification push buttons act in a similar manner.
2)The Orientation push buttons are used to specify which axis the labels should parallel. These push buttons are used in conjunction with the Label Plane push buttons. The Orientation push buttons make more sense once the Label Plane push buttons have been explained.
3) The Label Plane push buttons define which plane the label is to reside in. There are 6 possible planes corresponding to the six faces of a cube. The planes are defined as parallel to the axes in the push button name with the order of the plane names defining the normal vector or positive side of the plane (for example, the XY label plane is parallel to the X and Y axes and the normal vector is in the positive Z direction). The normal vector or positive side of the plane determines whether a label is forward and right side up when viewed from above or below. Once the plane for the label is chosen, the orientation of the label can be defined. In any given label plane, there are four possible label orientations. For example, in the XZ plane the labels can be parallel to the +X, +Z, -X or -Z axis. +X will cause the labels to parallel the X axis in the XZ plane and read from left to right, right side up. -X create labels parallel to the -X axis which, when viewed from the Azimuth 180 - elevation 0, will appear upside down.
The orientation of the label also affects how the justification push buttons affect the label. The justification push buttons move the text around a label box relative to the end of the tick mark. The label box is oriented parallel to the orientation push button selection. Therefore, if +Z orientation is chosen, the UC justification location appear to move the label to the middle left of the tick mark in Cartesian coordinates, when viewed normal to the XZ plane. The LL will appear to move the label to the lower right of the tick mark when viewed normal to the XZ plane.
Under All Axes Options
There are four special options:
Unique Label Colors allows you to have labels with different colors than the axes
Automatic Text Placement automatically handles the lable options based on centering options selected.
Set Axes Origin lets you change the labeling (e.g. to make axes with labels starting at zero in x, y and z)
© 1994-2018 ctech.com