
General Module Function
The file_statistics module is used to check the format of: *.apdv; *.aidv; *.geo; *.gmf; *.vdf; and *.pgf files, and to calculate and display statistics about the data contained in these files. This module also calculates a frequency distribution of properties in the file. During execution, file_statistics reads the file, displays an error message if the file contains errors in format or numeric values, and then displays the statistical results in the EVS console window.
ModuleInputPorts
Read_CSV_data_file (Yellow/Blue/Orange): This port receives data file names.
Z_Exag (Grey/Brown): This port receives the Z-Scale factor.
Module Output Ports
The output ports available from file_statistics depend on whether the Export button has been pushed. Prior to exporting the additional ports, there are four output ports:
Read_CSV_data_file (Yellow/Blue/Orange): This port exports data file names.
Z_Exag (Grey/Brown): This port exports the Z_Scale factor.
out_field (Blue/Black): This port is used to output point data to other modules such as scat_to_tin and scat_to_unif. This provides a means to perform linear or higher order interpolation using methods other than EVS’s kriging or IDW algorithms.
out_obj (Red): This port outputs a renderable geometry that consists of a cloud of points representing your data locations and values.
After Export, there are a total of 10 ports (including the four above). These are (from left to right):

Read_CSV_data_file (Yellow/Blue/Orange): This port exports data file names.
Z_Exag (Grey/Brown): This port exports the Z_Scale factor.
out_field (Blue/Black): This port is used to output point data to other modules such as scat_to_tin and scat_to_unif. This provides a means to perform linear or higher order interpolation using methods other than EVS’s kriging or IDW algorithms.
mean
median
min
max
number of points
The string (characters) representing the total output from Statistics.
out_obj (Red): This port outputs a renderable geometry that consists of a cloud of points representing your data locations and values.
Module Control Panel

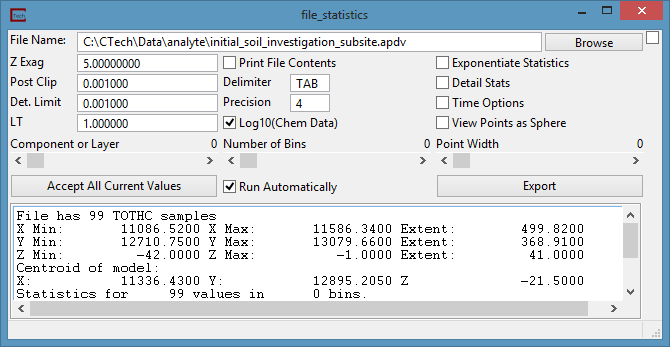
The control panel of file_statistics is shown in the figure above. The Browse button opens a File Browser which lists the files that are present in the current directory shown in the directory window. The file may also be typed into the type-in field and will be displayed there if selected in the browser.
The Z_Exag field is the vertical exaggeration of the model. This value can either be set in this field or imported from a different module.
The number entered into the Post Clip Min input field will be used during data processing to replace any sample property value that is less than the specified number. The default value for Post Clip Min is 0.001, but the user can enter any number. This is important if you wish to perform statistics following log10 processing.
The Det. Limit refers to the detection limit used when creating the input file. Any non-detect flag in the file (please see the help file for the file type being read for a list of non-detect flags) will be replaced the Det. Limit value.
The LT Multiplier field is used to input the Less Than Multiplier. This value is used whenever the ’r;<’ character preceeds a file value. The file value will be replaced by the product of the file value and the LT Multiplier.
The Delimiter field is a text field that represents how the statistics will be displayed in the modules statistics window, and in the printed file contents. This field can contain any string. Using the string "TAB", the default, causes the text to be tab delimited. This is the only specially handled string. Any other text (e.g. a space or a comma) will be literally used.
The Print File Contents check box allows the user to have the lines of data in the file printed to the console window, along with the results of the statistical calculations.
The Log10 toggle (only applicable for chem data files) causes the log of all data values to be taken after applying the "Post Clip Min" criteria. This parameter should be set to be consistent with the data processing that is being performed by the kriging or other modules that are contributing to the display.
The Detail Stats toggle causes the module to display the original statistical information along with more detailed statistics.
The Exponentiate Statistics toggle is used to exponentiate the statistics of log processed data.
The Time Options toggle displays the Time Options panel, which is discussed in the post_samples help.
The View Points as Spheres toggle causes all generated points to be displayed as spheres. When this option is selected the Point Width slider is replaced by a Sphere Radius field. Entering a value of less than zero in this field will allow the module to compute the radius of the spheres based on the coordinate extents of the module. If a value greater than 1 is placed in this field, that value will be used as the radius of the spheres.
The Component or Layer slider allows the user to select which property component (in a chem file) or geologic layer (in a geology file) will be considered during the current execution of the module. Note that the first component in the file is considered to be component 0 on this slider.
The Number of Bins slider allows the user to specify the bins that will be used to calculate the frequency histogram. The default value of 0 does not calculate a frequency distribution during execution of the module. The user can select any number of bins from 2 to 255 (note that a value of 1 is not valid).
The Point Width slider sets the size of the rendered pixels. The default is 0 which is equivalent to 1.
The Export button causes 6 additional output ports to be visible. These are described above.
The Accept All Current Values button causes the module to re-run.
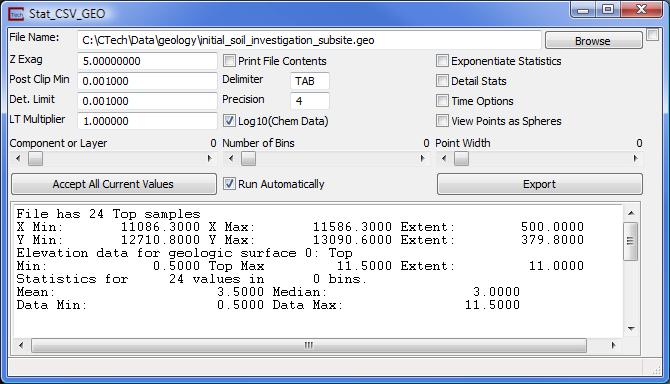
The output for execution of file_statistics is shown in the figure below.

For this run of the module, no errors were detected in the sample data file initial_soil_investigation_subsite.geo, and both basic statistics and a frequency distribution of 10 bins were calculated and printed. As the Print File Contents box was not checked, the contents of the file were not displayed in the window.
Related Modules
The statistics module performs similar functions on fields of data output from kriging modules.
© 1994-2018 ctech.com