

General Module Function
The Legend module is used to place a color scale bar in the viewer window. The Legend shows the relationship between the selected data component for a particular module and the colors shown in the Viewer. For this reason, the Legend's RED input port must be connected to the RED output port of a module which is connected to the Viewer and is generally the dominant colored object in view.
Many modules with red output ports have a selector to choose which ONE of the nodal or cell data components are to be used for coloring. The name of the selected data component will be displayed as the Title of the Legend if the Label Options are set to Automatic (default).
If the data component to be viewed is either Geo_Layer or Material_ID (for models where the grid is based upon geology), the Brown-Grey-Light Brown-Beige output port from Krig_3D_Geology must also be connected to Legend to provide the Geologic Layer (or material) names for automatic labeling. When this port is connected it will have no affect if any other data component is selected.
The minimum and maximum values are taken from the data input as defined in the datamap. Labels can be placed at user defined intervals along the color scale bar. Labels can consist of user input alphanumerical values or automatically determined numerical values. Legend has an output port which connects to the Viewer module.
Module Input Ports
Legend has three input ports.
(Red) : This port receives range and datamap information from any single module. The module connected to this port should contain the data that the Legend references. All modules that connect to the Viewer have a compatible output port.
(Brown-Grey-Light Brown-Beige) : This port receives geology info from those modules that read geologic data.
(Blue-Red-Blue-Beige) : This port is found on only a few modules in EVS/MVS. The modules with this port are contour_data, isolines, Datamap_Editor, and Legend.
These modules pass data corresponding to one or more subsetting levels (or solid contour levels). When this data is passed to Legend, it is used to set the precise break points in the legend where labeling will occur.
Module Output Ports
Legend has three output ports.
The blue-black (field) port allows the colored legend portion to be texture mapped with modules such as contour_texture.
The red port connects directly to the viewer.
Module Control Panel
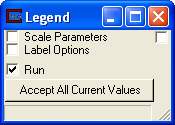
The primary control panel for Legend is shown in the figure above. This panel is used to spawn two control subpanels. The Accept All Current Values push button is used to apply all the currently selected scale and label settings.
The "Run" toggle controls whether the module will run when applications are loaded or data changes. When this is on, the module runs when applications are loaded or the "Accept" button is pushed. When it is off, the module will not run.
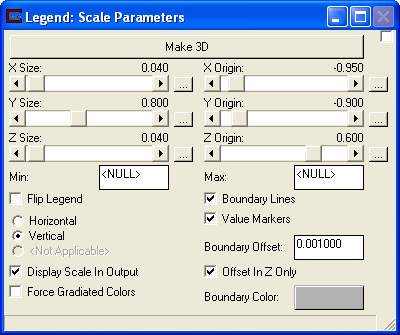
The Scale Parameters subpanel is shown above. The Make 3D button at the top changes the legend from non-transformable 2D to a fully 3D legend in the space of your model.
The X, Y, & Z Size and Origin sliders (and their associated type-ins accesible with the "" buttons), allow you to position the legend in 2D (fixed) or 3D transformable space.
The Min / Max type-in boxes are used to override the default range in the color scale. Caution should be used when changing these values because the Legend module will allow any numbers to be entered into these boxes. The minimum value will be placed at the bottom of the scale bar,the maximum at the top and the scale bar will be divided into equal pieces and labeled based on other settings in the module. Therefore, it is possible to have a data range from 0 to 10 and set the Legend to go from 100 to 500. In order to have the color scale bar labels exactly match the data, verify that the values type into the min and max values match the limits displayed below. If a more asthetically pleasing color scale is desired, either use an upstream clamp on the data before the module feeding Legend, or change the min and max value slightly to get even numbered increments. In the latter case, the color scale bar will not exactly match the data. However, if the data range is large and the changes to min and max are small, the differences should be negligible. The min and max of the input data range are displayed at the bottom of the control subpanel.
The Boundary Lines toggle specifies whether or not a boundary box is to be drawn around the Legend scale bar. A check in the box, the default, indicates that the boundary is to be displayed.
The Value Markers toggle specifies whether or not a tick mark is to be drawn at each label location.
The BoundaryOffset type-in offsets the labels from the Legend.
The Offset in Z Only toggle specifies whether (when on) to offset the boundary only in the z direction.
The Boundary Color button is used to set the color of the Legend boundary.
The Value Markers toggle specifies whether or not a tick mark is to be drawn at each label location.
The Flip Legend toggle inverts the legend putting high values at the bottom.
The Display Scale in Output toggle specifies whether or not to output the colored portion of the legend in the Legend’s red port. This should be on when you plan to texture map the legend.
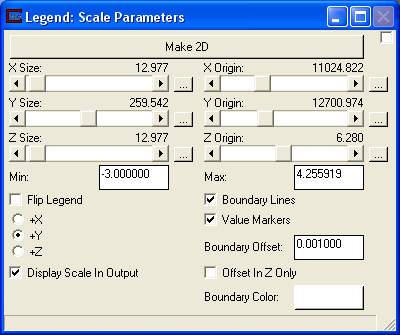
The Horizontal - Vertical radio buttons determine the orientation of the legend. When the legend is 3D, this panel changes (as shown above) and you can choose whether the lengend is aligned with the X, Y, or Z axes.
The Force Gradiated Colors toggle will cause the Legend to display gradiated colors instead of solid color breaks when contour data is passed in.
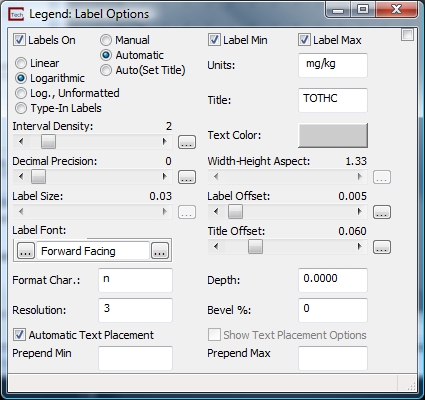
The LabelOptions subpanel is shown above.
The Labels On toggle is used to specify whether or not the data labels are to be displayed with the Legend. A check in the box, the default, indicates that they are to be displayed.
The Manual radio selection specifies that the user will:
set how the data was processed,
set the title, and
set the units.
The Automatic radio selection specifies whether or not the legend should automatically determine log vs. linear, apply the data component name as a title, and apply the units specified in the input field.
The Auto(Set Title) radio selection behaves the same as the Automatic radio selection but will use a user specified title.
The Label Min toggle places a label at the bottom (min) of the data. This only applies to linear or log unformatted.
The Label Max toggle places a label at the top (max) of the data. This only applies to linear or log unformatted.
The Interval Density slider is used to specify the number of label increments to display in the color scale bar. The interval density has different meanings depending on whether logarithmic or linear is chosen in the Main Legend Parameters control subpanel. If linear is chosen, the label density is the number of increments between the min value and the max value. The maximum label density is 31 and the number of labels will be the label interval plus 1. If logrithmic is chosen, the label density is the number of increments per decade. The maximum label density value allowed is 3 ( however, any number larger than 3, up to 31, can be chosen and the display will display the same as if 3 was chosen) and the number of data labels displayed will be the number of decades times label density plus 1.
The Resolution type-in specifies the number of decimal places for the numbers. Together with the Format Char you can create a wide variety of legend labels.
The Format Char.: type-in specifies how to format the numbers on the legend. The following values can be used:
’r;n’ (default): Number format: The value is converted to a string of the form "-d,ddd,ddd.ddd..." The symbols used for thousands and decimal separators are determined in the Regional Settings of the Windows Control Panel.
’r;f’: Fixed format: The value is converted to a string of the form "-ddddddd.ddd"
’r;e’: Scientific Notation: The value is converted to a string of the form "-d.ddd...E+ddd". The resulting string starts with a minus sign if the number is negative. One digit always precedes the decimal point.
’r;g’: General format: The value is converted to the shortest possible decimal string using fixed or scientific format.
’r;m’: Money format: The value is converted to a string that represents a currency amount. The format is controlled by the Regional Settings in the Windows Control Panel, and will include the currency symbol, thousands separator, and decimal separator as specified in the Regional Settings.
The Legend Type radio buttons specify if the data is linear, logarithmically transformed (formatted or unformatted) or has Type-In Labels. Logarithmic is the default. Log Unformatted is similar to linear, but with log values. Type-in lables opens a new window where you can type in any label for each interval.
The Label Size,Label Offset and Title Offset sliders sets the label and title height and position relative to the legend length.
The LabelFont selector sets the font used for all labeling. For more information on Font Selection Click Here.
Depth and Bevel are options for using true 3D beveled text. See Text_3D for a complete description of these.
The Width-Height Aspect slider determines the aspect ratio of the label text. A small width to height ratio creates narrow text and a large ratio creates wide text. The default is 0.90 and the range is from 0.20 to 1.50. The decimal Prec. slider is used to indicate the number of decimal places to display in the labels. The default in 1 and the range is from 0 to 6. Precision only applies to linear ranges. The Label font slider is used to determine which font style is used for the labels. The default is font 0 and the range is from 0 to 5. The font styles are not currently documented.
The Text Color button is used to set the color of the Legend labels.
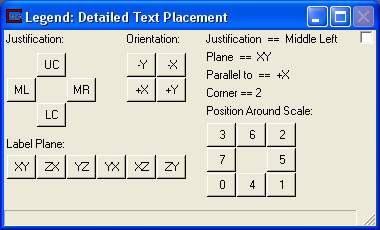
If you turn off the Automatic Text Placement toggle and turn on the Show Text Placement Options toggle, another window (shown below) appears with options for more specific text justification.
The Prepend Min and Prepend Max will prepend the selected text to either the min value or the max value label in the legend.
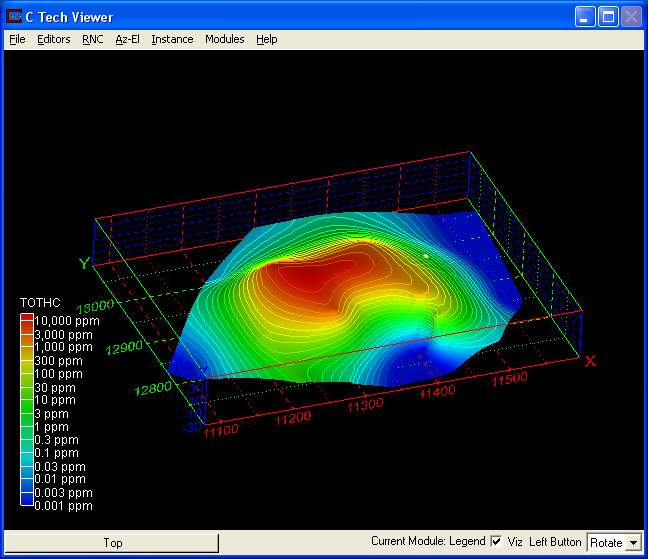
Below is an example of a color scale bar produced by the Legend module.
Related Modules
-> Viewer
© 1994-2018 ctech.com