![]()
General Module Function
The streamlines module is used to produce streamlines or streamribbons of a field which is a 2 or 3 element vector data component on any type of mesh. Streamlines, which are simply 3D polylines, represent the pathways particles would travel based on the gradient of the vector field. Streamribbons are 3D streamlines which can be rendered. At least one of the nodal data components input to streamlines must be a vector. The direction of travel of streamlines can be specified to be forwards (toward high vector magnitudes) or backwards (toward low vector magnitudes) with respect to the vector field. Streamlines are produced by integrating a velocity field using the Runge-Kutte method of specified order with adaptive time steps.
Module Input Ports
Streamlines has three input ports. Data passed to the first port (the left port) can have a mesh of any type, and must have at least one vector nodal data component. To generate streamlines of scalar data, a module such as gradient must be used to calculate the gradient of a scalar field. The second port accepts data specifying the starting location of the streamlines. This data is typically generated by the slice or isolines or place_glyph modules. The last port is the z exaggeration factor. This input causes the stream path generation to be calculated in an unscaled system ensuring that velocities are not scaled and are accurate, then scales the position of the streamlines.
Module Output Ports
Streamlines has two output ports. The leftmost output port creates a new unstructured polyline mesh representing the streamlines. The output also contains a nodal data component referencing the velocity component. The right output port can send either streamline polylines or renderable streamribbons to the viewer.

Module Control Panel
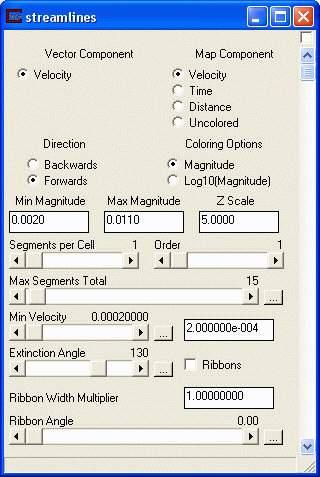
The control panel for streamlines is shown in the figure above.
The VectorComponent radio button displays all data components (vector and scalar) passed to streamlines. By default, the first (0th) component is selected.
The Map Component radio button allows you to choose which computed data component to use for coloring the lines. Choices are Velocity, Time, Distance and Uncolored.
The Direction radio buttons allow the user to specify forward or backward streamlines. Forward streamlines start from the specified starting points and travel to the maximum velocity location. Backward streamlines travel from the specified starting points to the minimum or zero velocity location.
The Coloring Options radio buttons allow the user to specify Magnitude (normal) or Log10(Magnitude) representation of the velocity data for coloring purposes. When velocities span several orders of magnitude working in log space is useful.
The Min Magnitude and Max Magnitude type-ins display the min/max velocities represented in the input field. Changing these values allows the user to reset the min-max values for coloring purposes. NOTE: once you change these values they will not automatically update.
The Z Scale type-in reflects the value of the z exaggeration port.
The Segment per Cell slider is used to set the number of integration steps to be used in each cell (i.e., the number of divisions of the cells) to calculate the streamline. The default is one and the range is 1 to 16.
The Max Segments Total slider is used to set the maximum allowable number of streamline segments that will be completed for each streamline. If the number of segments along a streamline exceeds the max number, the streamline is terminated at the end of the last (max) segment. The default is 15 and the range is 1 to 1000.
The Order slider is used to set the order of the integration. Higher order integration is more accurate, but executes much slower. The default is one and the range is 1 to 4.
The Min Velocity slider and type-in is used to specify the minimum velocity that will be considered in the integration. If the magnitude of the velocity field in a region is less than this minimum value, streamlines will end in that region (or will not be produced if the gradient at a starting point is less than the min). Setting this to a lower value will produce longer streamlines (and typically more). Higher values tend to produce less streamlines and shorter streamlines. If streamlines are not visible on the data set, setting this to a lower value may produce streamlines. The default value is 0.000001.
The Extinction Angle slider is used to specify the maximum allowable angle between successive line segments before integration (streamline generation) should be terminated. The default value is 130 degrees.
Streamribbons are essentially three dimensional streamlines which are renderable by the viewer.
The Ribbons check box is used to set the output to streamribbons (on) or streamlines (off). If the box is checked, then the ribbon width edit field can be used to set the width of the ribbons. The value entered here is a scale factor (relative to the divergence, or absolute value of the vector magnitude) used to set the width of the beginning point of the ribbon.
The Ribbon Width Multiplier scales the divergence (or magnitude) of the vector field. The default is 1.00 and the range is unbounded.
The Ribbon Angle slider, controls the initial angle at which the ribbon is drawn. The default is 0 and the range is 0 to 360. Note that if the ribbon angle is 0, the view may need to be rotated to see the ribbons.
The calculation of streamribbons is complex, and can be somewhat unstable if the parameters for calculating the streamlines are not set correctly. The user should experiment with different values of the streamline parameters if the module fails during production of stream ribbons. Setting order and nsegment to 2 or more will improve stability for ribbons.
Related Modules
->glyph
->gradient
© 1994-2018 ctech.com